Written in Livemark
(2022-06-22 04:52)
(2022-06-22 04:52)
Data fallacies
"Statistics never lie, but lovers often do..." (J. Tinga, Antonio vs. Reyes, 484 SCRA 353 (2006))
With all due respect to Justice Tinga but statistics and data do lie and they do it quite often.
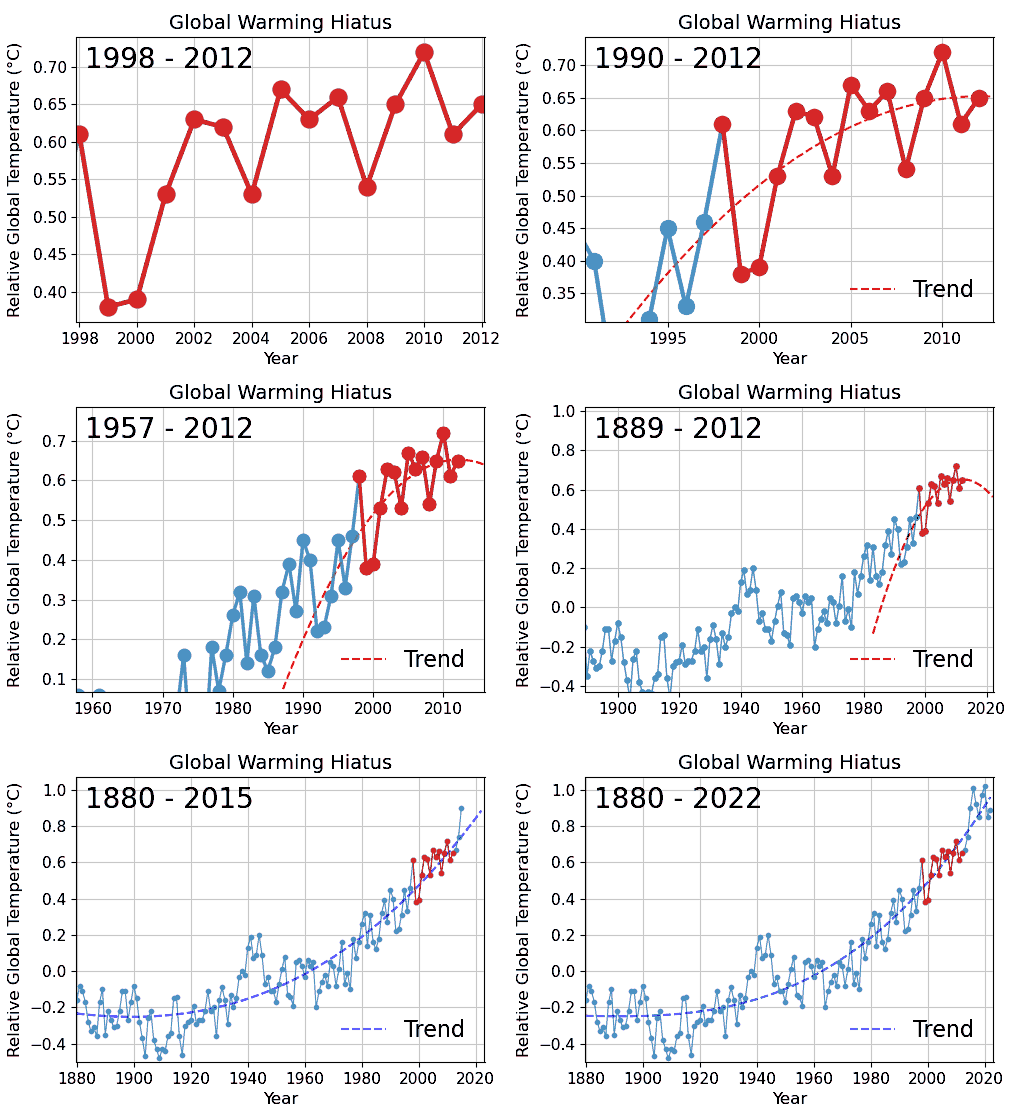
Cherry picking

What it is
- Cherry picking is also known as suppressing evidence or the fallacy of incomplete evidence.
- Selecting, using, and presenting only the subset of the data that agree or fit with your claims and beliefs.
- This becomes really dangerous when paired with people’s confirmation bias.
How to avoid it
- As a creator, always be faithful to your data and results especially when they do not fully agree with your claims.
- As a consumer, ask for the complete dataset or ask yourself: “What am I not being told?”
Data dredging
What it is
- Data dredging refers to the misuse of data analysis to find patterns in data that can be presented as statistically significant.
- Seeking correlation where there is none. Performing countless statistical tests on data and reporting the ones that show correlation.
- If you combine enough time with a large enough dataset, you are bound to find things that appear to be correlated.
How to avoid it
- Always be upfront with what you are testing—e.g. using a hypothesis in the analyze step of the data pipeline.
- Accept that sometimes things that seem to be correlated aren’t.
Survivorship bias
What it is
- Survivorship bias is the logical error of drawing conclusions from an incomplete dataset composed of data that has survived a selection process and overlooking those that did not, typically because of their lack of visibility.
-
Example:
- Bullet patterns of WW2 aircrafts returning from the war
- College dropouts being billionaires—for every 1 dropout who ended up becoming a billionaire, how many thousands more did not?
How to avoid it
- Always try to look at the full picture and ask yourself if you are overlooking anything or if something is missing in your data.
- Ask yourself: "Did your data undergo any selection or trimming process prior to your analysis?"
Sampling bias

What it is
- Sampling bias occurs when a sample is selected in a way such that some members of the intended population have a lower or higher chance of being included in the sample.
- Results in conclusions drawn from a dataset that is not representative of the population you are trying to understand.
-
Example:
- Using an online poll to determine whether students are in favor of online classes.
How to avoid it
- Always try to use a representative sample of your population in your analysis.
- Choose an appropriate and robust sampling method.
Cobra effect

What it is
- When an attempted solution to a problem somehow makes it worse as an unintended result of using incorrect stimulation or wrong incentives.
- Other examples.
How to avoid it
- Be careful what you are incentivizing because incentives generally increase the likelihood of what you are incentivizing.
Gerrymandering / MAUP

What it is
- In both gerrymandering and the Modifiable Areal Unit Problem (MAUP), the outcome of an event (e.g. election, analysis) can vary depending on how you divide the area of interest.
How to avoid it
- Always consider the scale and how you group your data when doing your analysis. Try to see if your results also vary when you vary your scale.
False causality

What it is
- The belief that because two events occur together or immediately after one another then one must have caused the other.
- Correlation does not imply causation.
How to avoid it
- Never assume causation based on correlation alone.
Danger of summary metrics

What it is
- Reliance on summary metrics blur out differences in the dataset. Some datasets may have the same summary metrics (e.g. mean, variance, correlation) but be totally different from each other.
- Example:
How to avoid it
- As a provider, show or open the data used for the study instead of just the summary statistics.
- As a consumer, always look or ask for the data behind the summary statistics used.
Other data fallacies
- Simpson's paradox - A phenomenon in probability and statistics in which a trend appears in several groups of data but disappears or reverses when the groups are combined.
- Gambler's fallacy - The erroneous belief that if an event occurs more frequently than normal in the past then it is less likely to occur in the future, when it has already been established that the probability of such events do not depend on what happened in the past.
- Hawthorne effect - Also known as the Observer Effect. This is the phenomenon where the actions and behaviors of the subjects of a study change because they are aware that they are being observed/monitored.
- McNamara fallacy - Being too focused on what can easily observed and assuming that does that cannot are irrelevant. This leads to decisions based solely on quantitative observations (i.e., metrics, hard data, statistics) while all qualitative factors are ignored.
- Publication bias - Refers to the fallacy that the outcome of a research or experiment influences whether it is published instead of the robustness of the methodology. This results in an imbalance in published papers in favor of positive results when, in reality, more researches using the same methodology but showing negative or inconclusive results may exist.
For more information, you can refer to Data fallacies by Geckoboard.