(2022-06-19 14:24)
Making good infographics
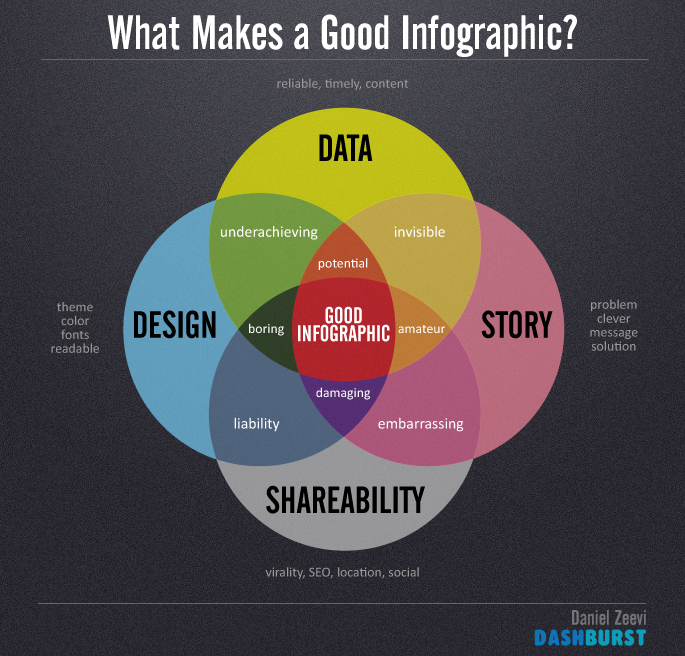
The figure above provides a good overview of what makes a good infographic—it is the combination of good data, good design, a good story, and shareability. Although you can still technically make an infographic even if you lack one of the four elements, doing so would lead to your inforgraphic becoming less effective, or worse, dangerous/damaging.
Data
A good inforgraphic requires good data as mentioned in the section about data trustworthiness, completeness, and quality in the data pipeline's verify step. As with most processes, making a good infograghic—or any data visualization for that matter—follows the principle of garbage in, garbage out.
An infographic that lacks good data but has all the other elements is the most dangerous kind.
Design
A good design hooks your audience and catches their attention. This involves choosing the correct design elements—typography, color, layout, imagery—to make your infographic attractive, engaging, and, most importantly, understandable.
An infographic that lacks good data but has all the other elements will lack polish and look amateurish.
Story
The design might catch your audience's attention but it is the story you tell that will keep them reading your infographic. Telling a compelling and interesting story is imperative if you want to effectively communicate your message.
An infographic that lacks good story but has all the other elements will be a boring one that's easily forgotten.
Shareability
Shareability refers to the potential of your inforgraphic to be shared among your target audience and even beyond it—how much reach does your infographic have. This involves decisions such as the format of your infographic, the platforms where it will be posted, and how easily it can be searched online.
Shareability is critical in digital spaces and the lack of it would severely decrease the potential of your infographic.