Basic Raster Processing & Analysis
BEN HUR S. PINTOR
Basic Raster Processing & Analysis
by Ben Hur S. Pintor
version 2020.05
This work and its contents by Ben Hur S. Pintor is licensed under a Creative Commons Attribution-NonCommercial-ShareAlike 4.0 International License.
You are free to:
Share — copy and redistribute the material in any medium or format
Adapt — remix, transform, and build upon the material
Under the following terms:
Attribution — You must give appropriate credit, provide a link to the license, and indicate if changes were made. You may do so in any reasonable manner, but not in any way that suggests the licensor endorses you or your use.
NonCommercial — You may not use the material for commercial purposes.
ShareAlike — If you remix, transform, or build upon the material, you must distribute your contributions under the same license as the original.
Other works (software, source code, etc.) referenced in this work are under their own respective licenses.
Geospatial Generalist. Open Stuff Advocate. Datactivist + Maptivist.
Ben Hur is a free and open stuff advocate based in The Philippines who likes to work at the intersections of the geospatial, data, development, and openness fields. He received his Bachelor’s degree in Geodetic Engineering from the University of the Philippines and, at the time of this writing, is working towards his Master’s degree in Geomatics Engineering with a specialization in GeoInformatics. His first experience with QGIS was with version 1.5 Tethys in 2010 but he started using it consistently in 2012 with version 1.8 Lisboa.
He is an alumnus of the School of Data Fellowship and Data Expert Programme and has provided training, support, and consulting services on data literacy and free and open sources software for geospatial (FOSS4G) applications such as QGIS, GRASS, and GeoNode to individuals, private corporations, and organizations.
In 2019, he established BNHR (https://bnhr.xyz) as a way to advocate for open data and open source while helping others create sustainable and beneficial solutions to their spatial and data problems using open technologies like QGIS. He is a QGIS Certified Instructor and currently the only QGIS Sustaining Member in the Philippines.
He is an active member of the open mapping community in the Philippines and regularly organizes, supports, and volunteers for activities such as Pista ng Mapa, MaptimeDiliman, and local Open Data Day events.
Learn more about him at https://bnhr.xyz.
Standing on the shoulders of giants.
This workbook is an ever evolving piece of work that reflects my learnings and realizations over the years. The information provided here consists of my own experiences and those that I’ve gathered from the experiences of others from whom I have taken inspiration.
The names of everyone I’ve learned from over the years may be too many to mention but I would like to acknowledge the QGIS Project and its volunteers for the Official QGIS Documentation and User Guide and the local and global FOSS4G and QGIS communities among the many inspirations and resources that I had in creating this workbook.
Basic Raster Processing & Analysis 0
What you should already know 5
Downloading data using the SRTM Downloader plugin 7
Exercise 1: Downloading SRTM Digital Elevation Models into QGIS 7
Exercise 2: Merging the SRTM DEMs into one raster 9
Exercise 3: Using a polygon/mask layer to clip a raster 12
Exercise 4: Reprojecting a raster 15
Exercise 5: Generating contours 17
Exercise 6: Computing for the slope and aspect 18
Exercise 7: Computing for the solar radiation/insolation 20
Exercise 8: Getting solar radiation values at points using the Point Sampling Tool 23
Exercise 9: Getting the average solar radiation values per city/municipality using Zonal Statistics 25
Exercise 9: Reclassifying the GHI raster 27
Exercise 10: Using the raster calculator 29
This workbook is designed to introduce you with processing algorithms for working with rasters in QGIS. By the end of the workbook, you should know: merge and clip rasters; work with topography; sampling rasters; reclassifying rasters; and using the raster calculator. |
Since this is a beginner workbook, no previous knowledge of GIS or QGIS is required. Other learning resourcesOfficial QGIS Documentation (QGIS 3.10) Official QGIS Documentation (latest, QGIS 3.16) BNHR Facebook & Twitter & YouTube Free and Open Source GIS Ramblings by Anita Graser Klas Karlsson’s Youtube channel QGIS User Group Philippines Facebook Page Geographic Information Science Philippines Facebook Page |
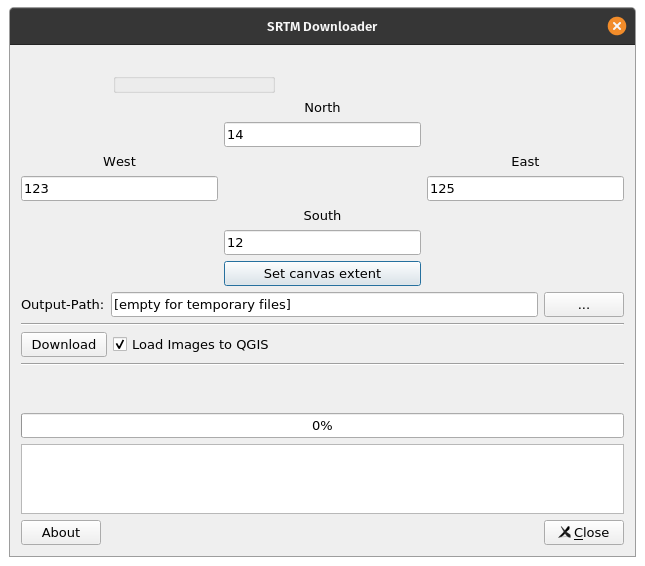
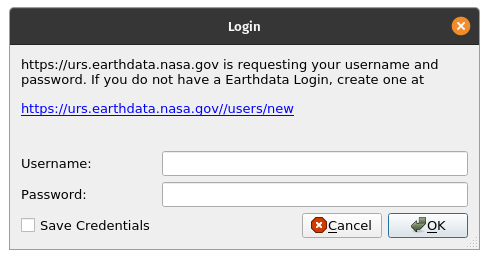
Exercise 1: Downloading SRTM Digital Elevation Models into QGISSRTM (Shuttle Radar Topography Mission) is a global research endeavor that yielded nearly-global digital elevation models (DEM). QGIS has a plugin called the SRTM Downloader that allows for SRTM data to easily be downloaded straight from QGIS. SRTM data downloaded by the plugin is in the form of .hgt files. In order to download SRTM data using the plugin, you should have a working NASA Earth Data account available, if not you may create one at https://urs.earthdata.nasa.gov/users/new. For this exercise, let’s try to download SRTM data for the province of Albay.
| |
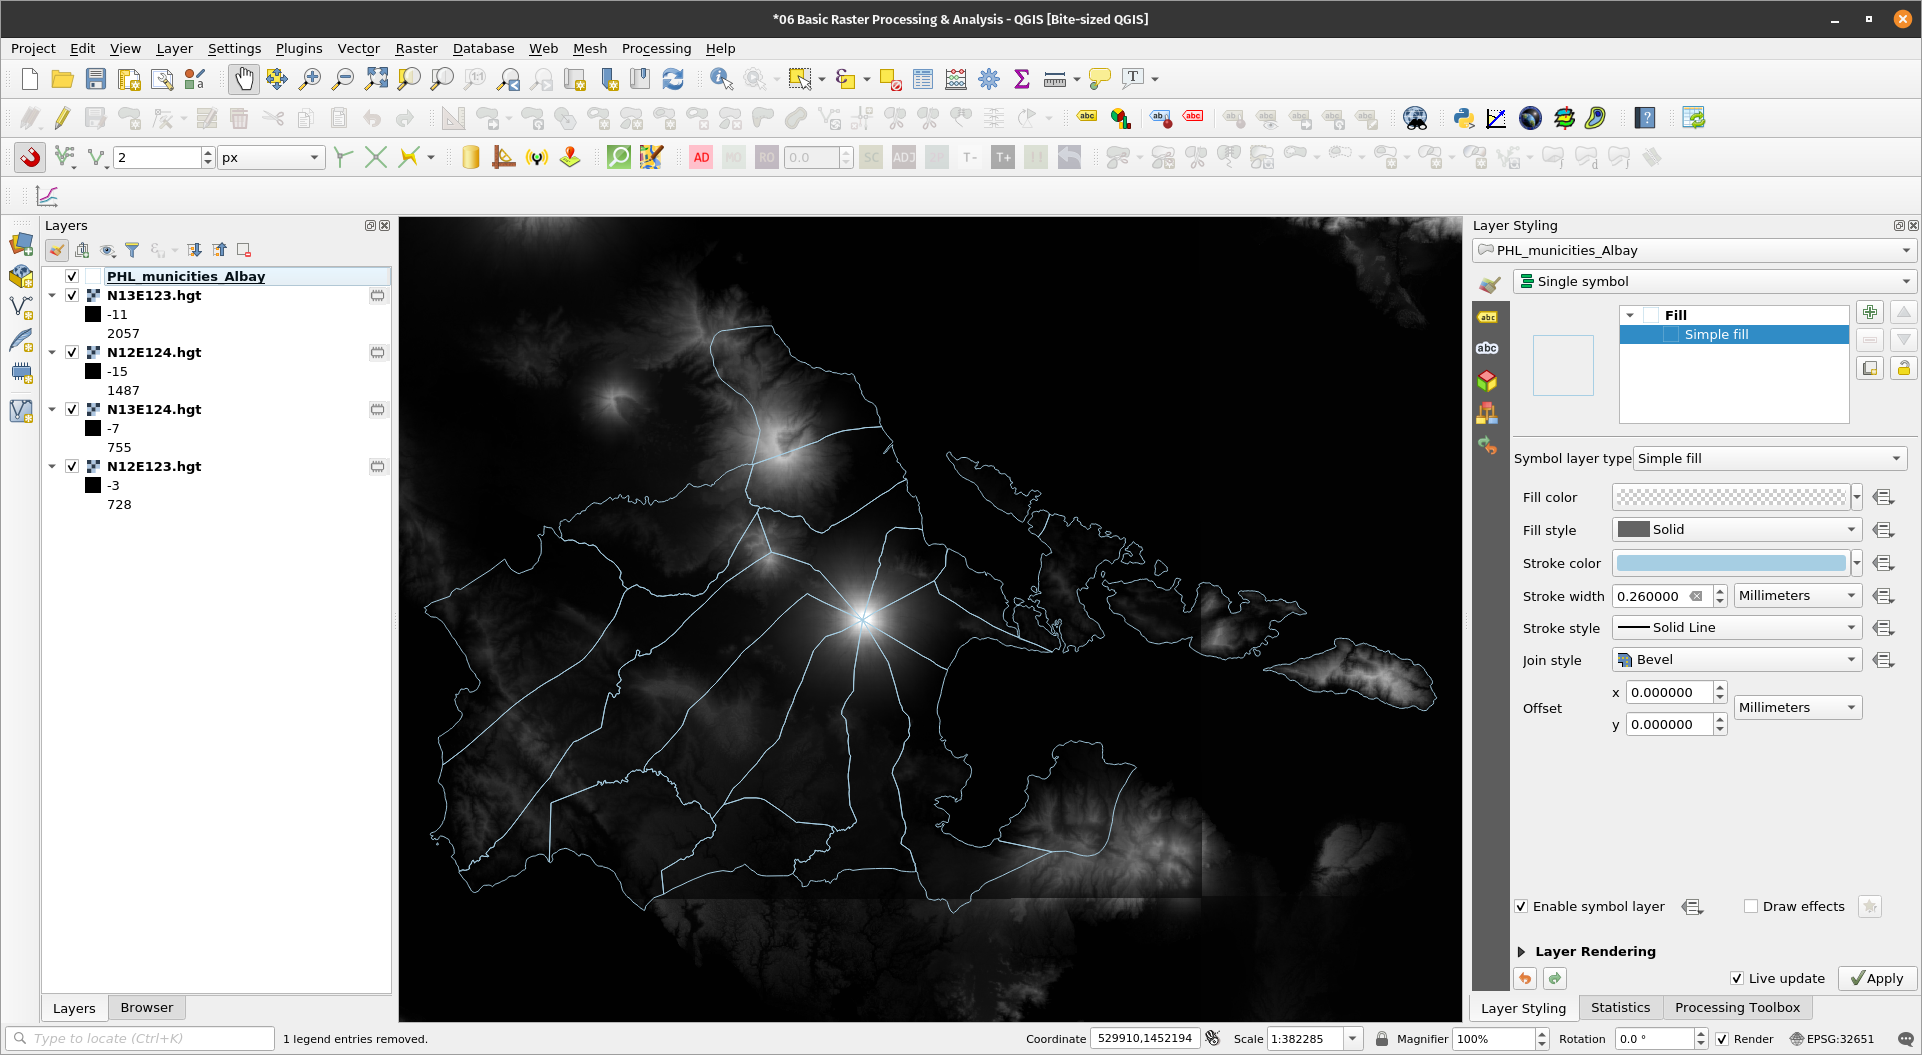
Notice that the loaded SRTM layers are memory layers and if you open their properties, they are in SRTMHGT File Format. BONUS: What is the data type and no data value for the loaded SRTM layers? | |
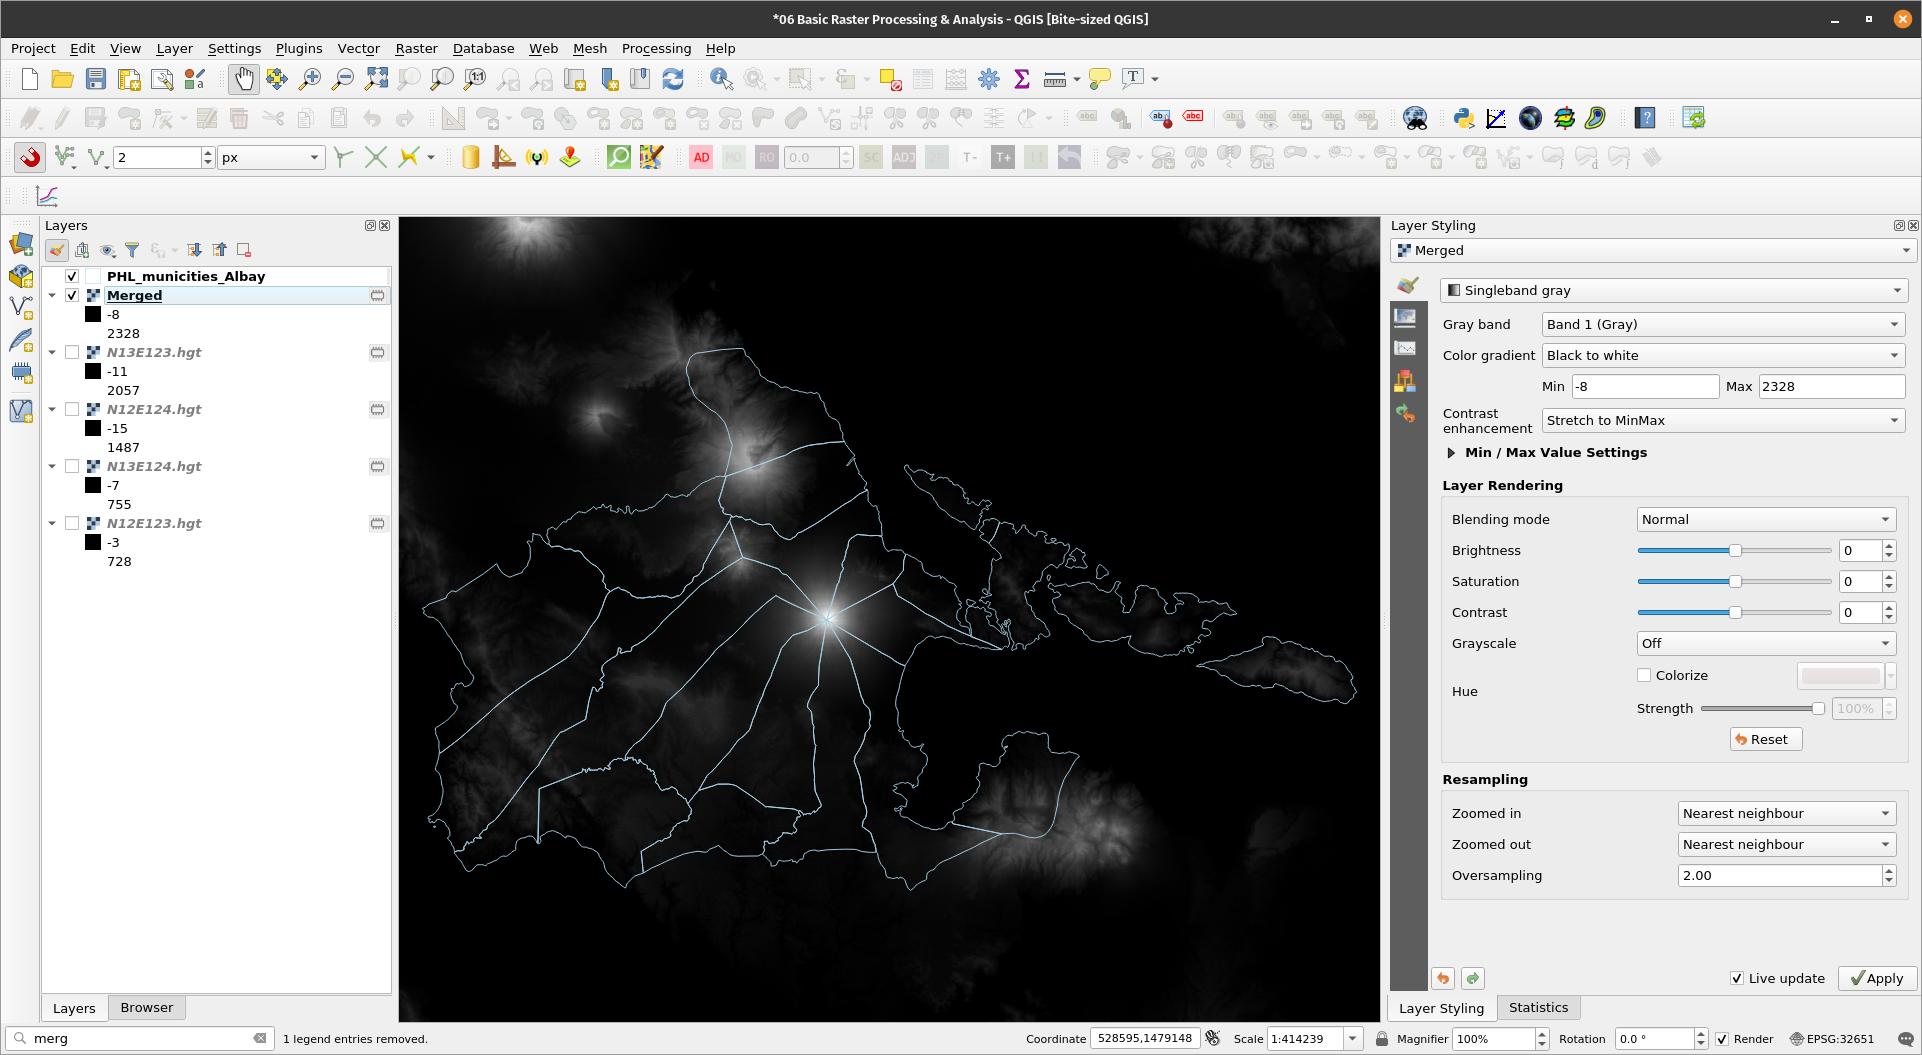
If you noticed, we were able to download four SRTM layers but for our next analyses, we only need one that covers the entire province of Albay. Just like vectors, QGIS also allows for rasters to be merged. In this exercise, we will merge the four SRTM layers into one using the Merge algorithm. Exercise 2: Merging the SRTM DEMs into one raster
| |
BONUS: Notice that at the bottom of the GDAL algorithm there is a part labelled GDAL/OGR console call. This is the GDAL/OGR command that is run when running the algorithm. If you know how to use GDAL/OGR, you can customize this command by using the Additional command-line parameters. | |
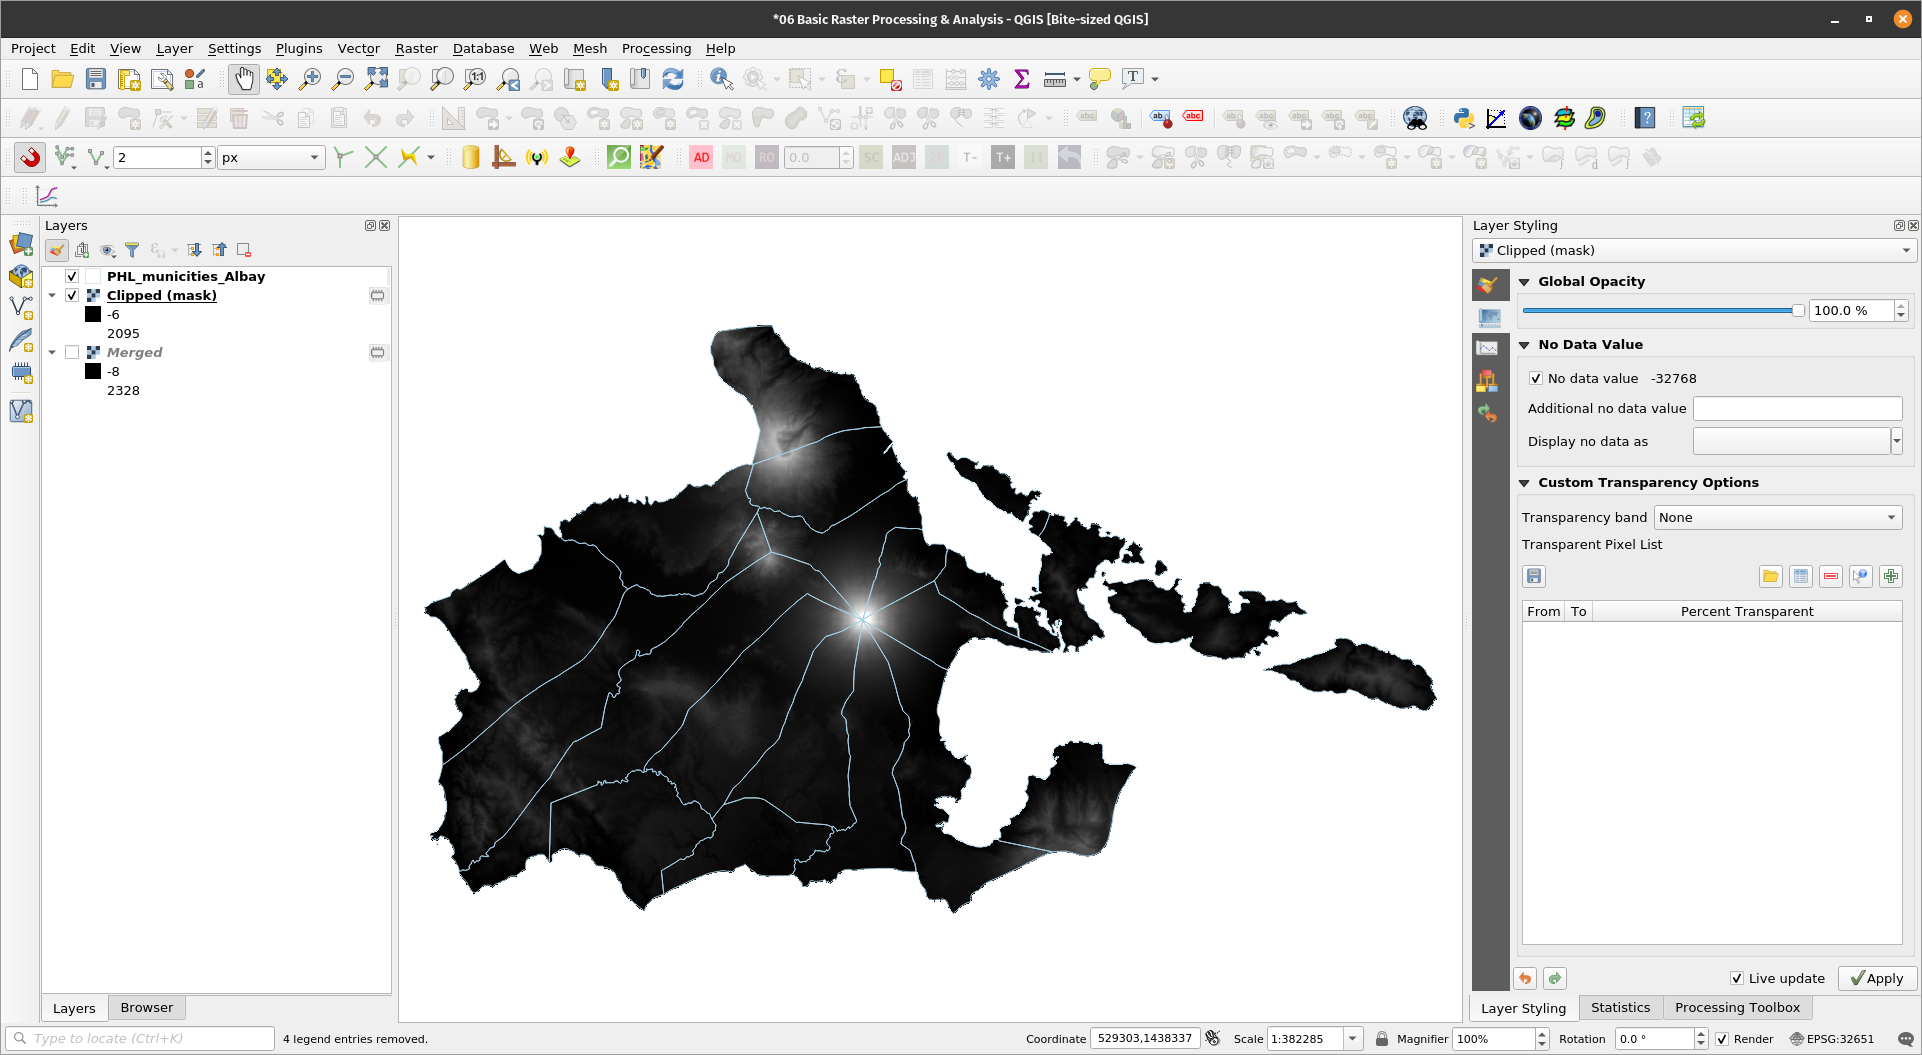
Now we should have one raster layer covering the entire Albay province. However, notice that the raster also includes areas outside of Albay. If we want to create a raster that includes only the extent or area of Albay, we can use the Clip by extent or Clip by mask layer algorithms in QGIS. As with other algorithms available in QGIS, there are several clip functions that we can use -- the default QGIS/GDAL function, the one in GRASS, the one in SAGA, etc. For this exercise, we’ll use the default QGIS/GDAL functions to clip the Merged layer using the Albay polygon. Exercise 3: Using a polygon/mask layer to clip a raster
| |
BONUS: Try to use the other algorithms. What are their differences, if any? | |
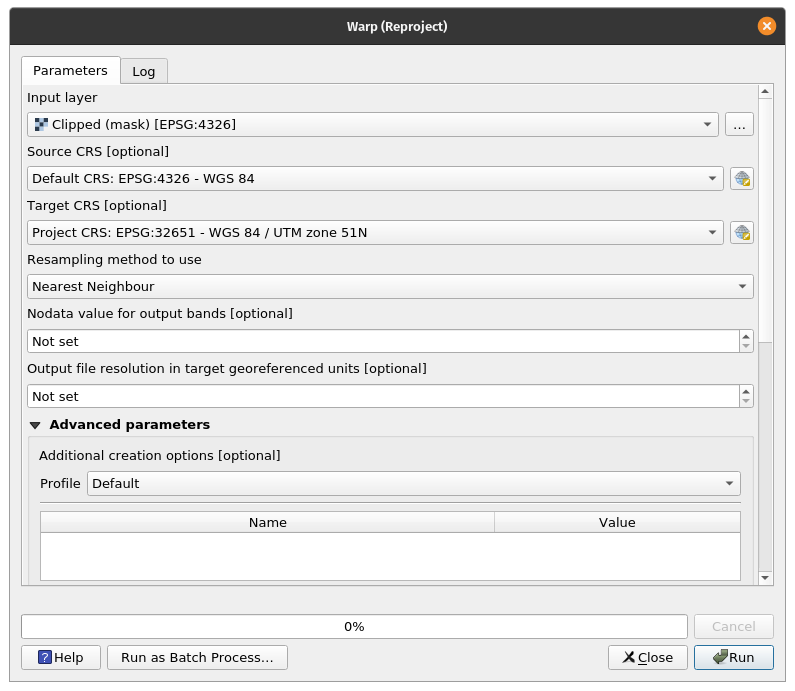
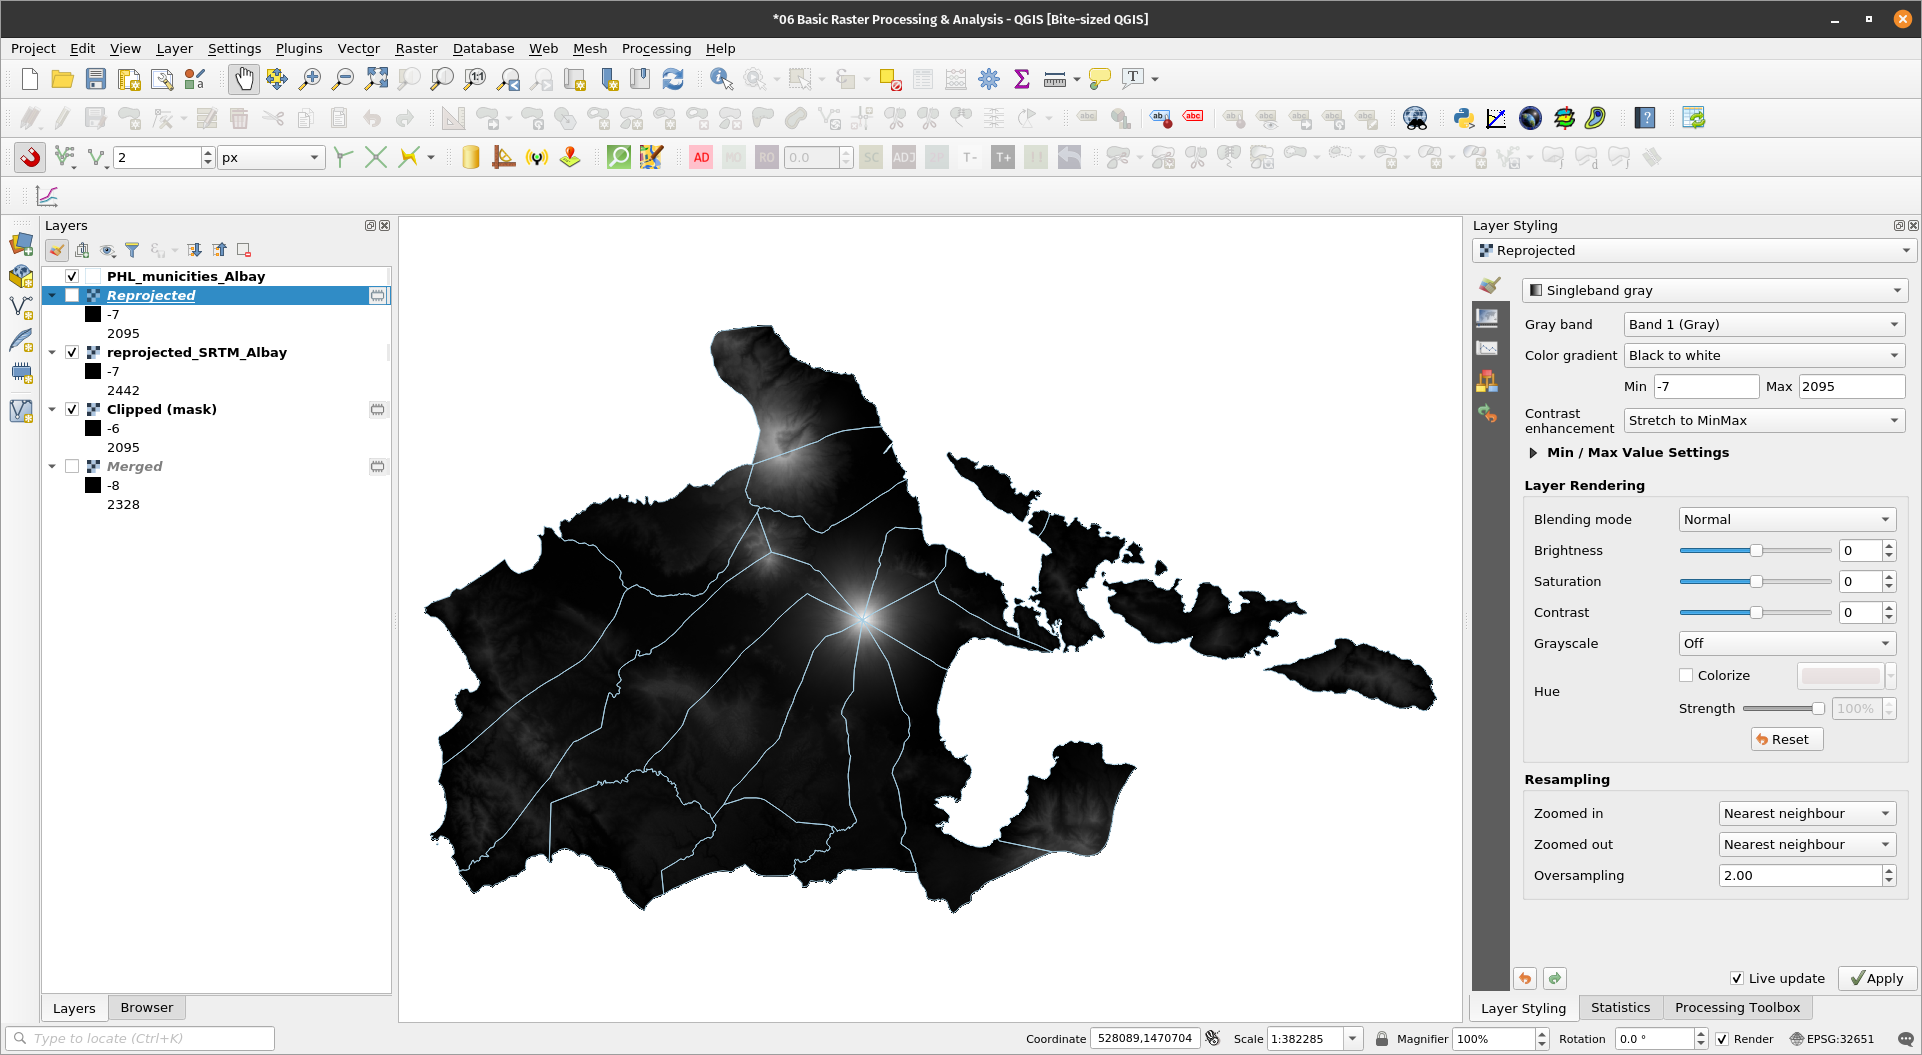
As with vectors, there are several ways to reproject a raster. The easiest is by exporting the layer and setting the new CRS there. Another is by using the Reproject algorithm. Exercise 4: Reprojecting a raster
| |
| |
BONUS: Try to reproject the raster by exporting it. Which one is easier? | |
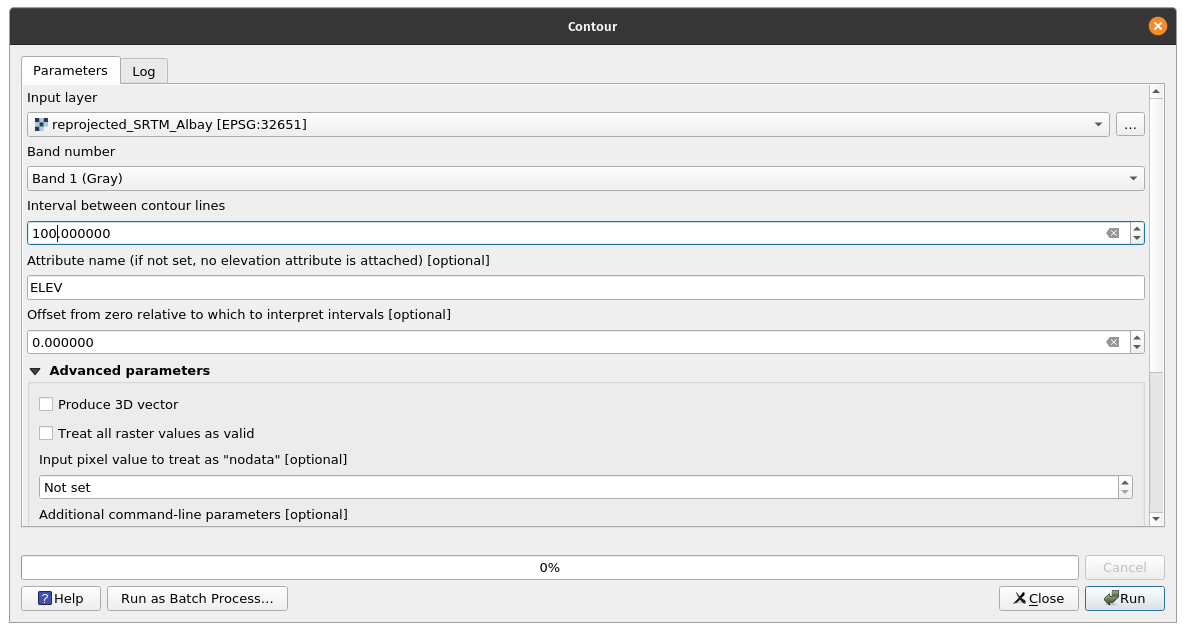
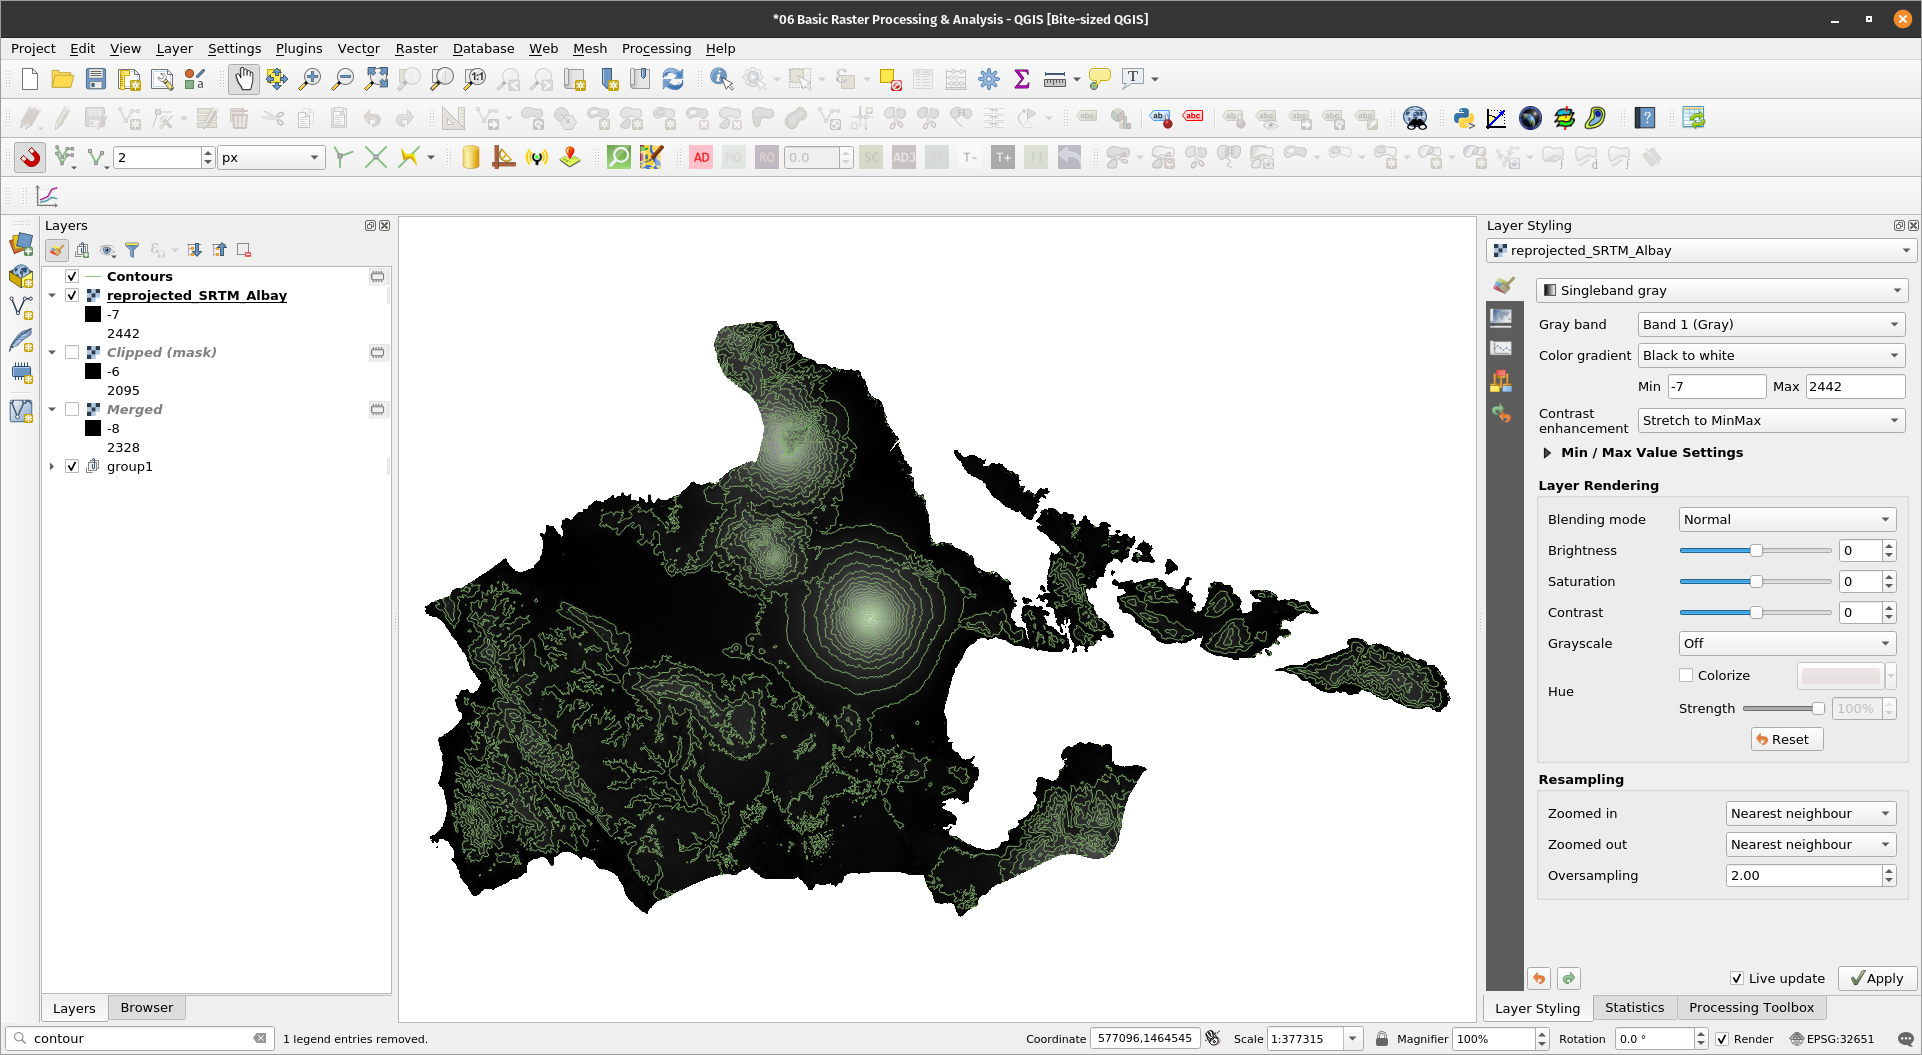
Working with topography and topographic data (e.g. Digital Elevation Models) is one of the most common things we do with GIS. Exercise 5: Generating contoursGenerating contours is one of the most common ways to work with elevation or topography data. QGIS easily generates contours from DEMs using several Contour algorithms available to it.
| |
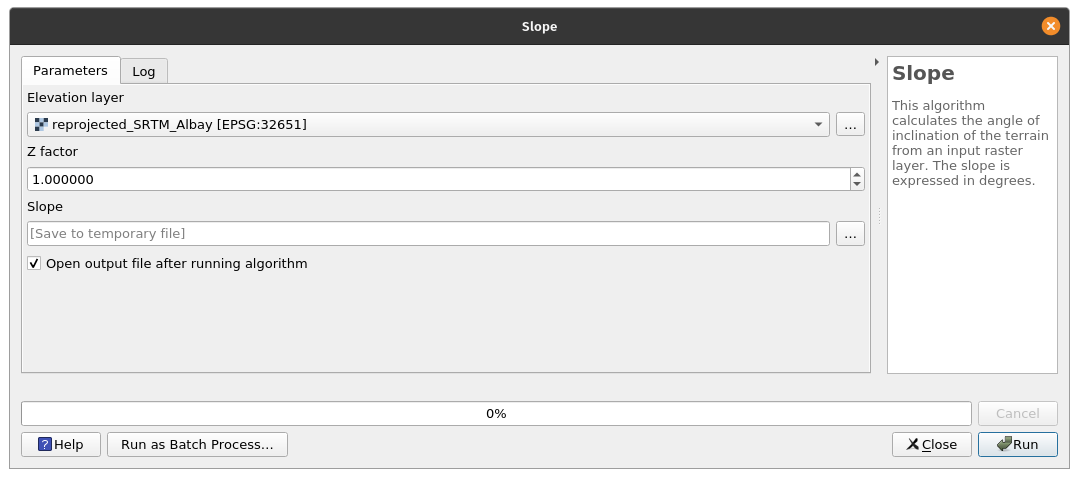
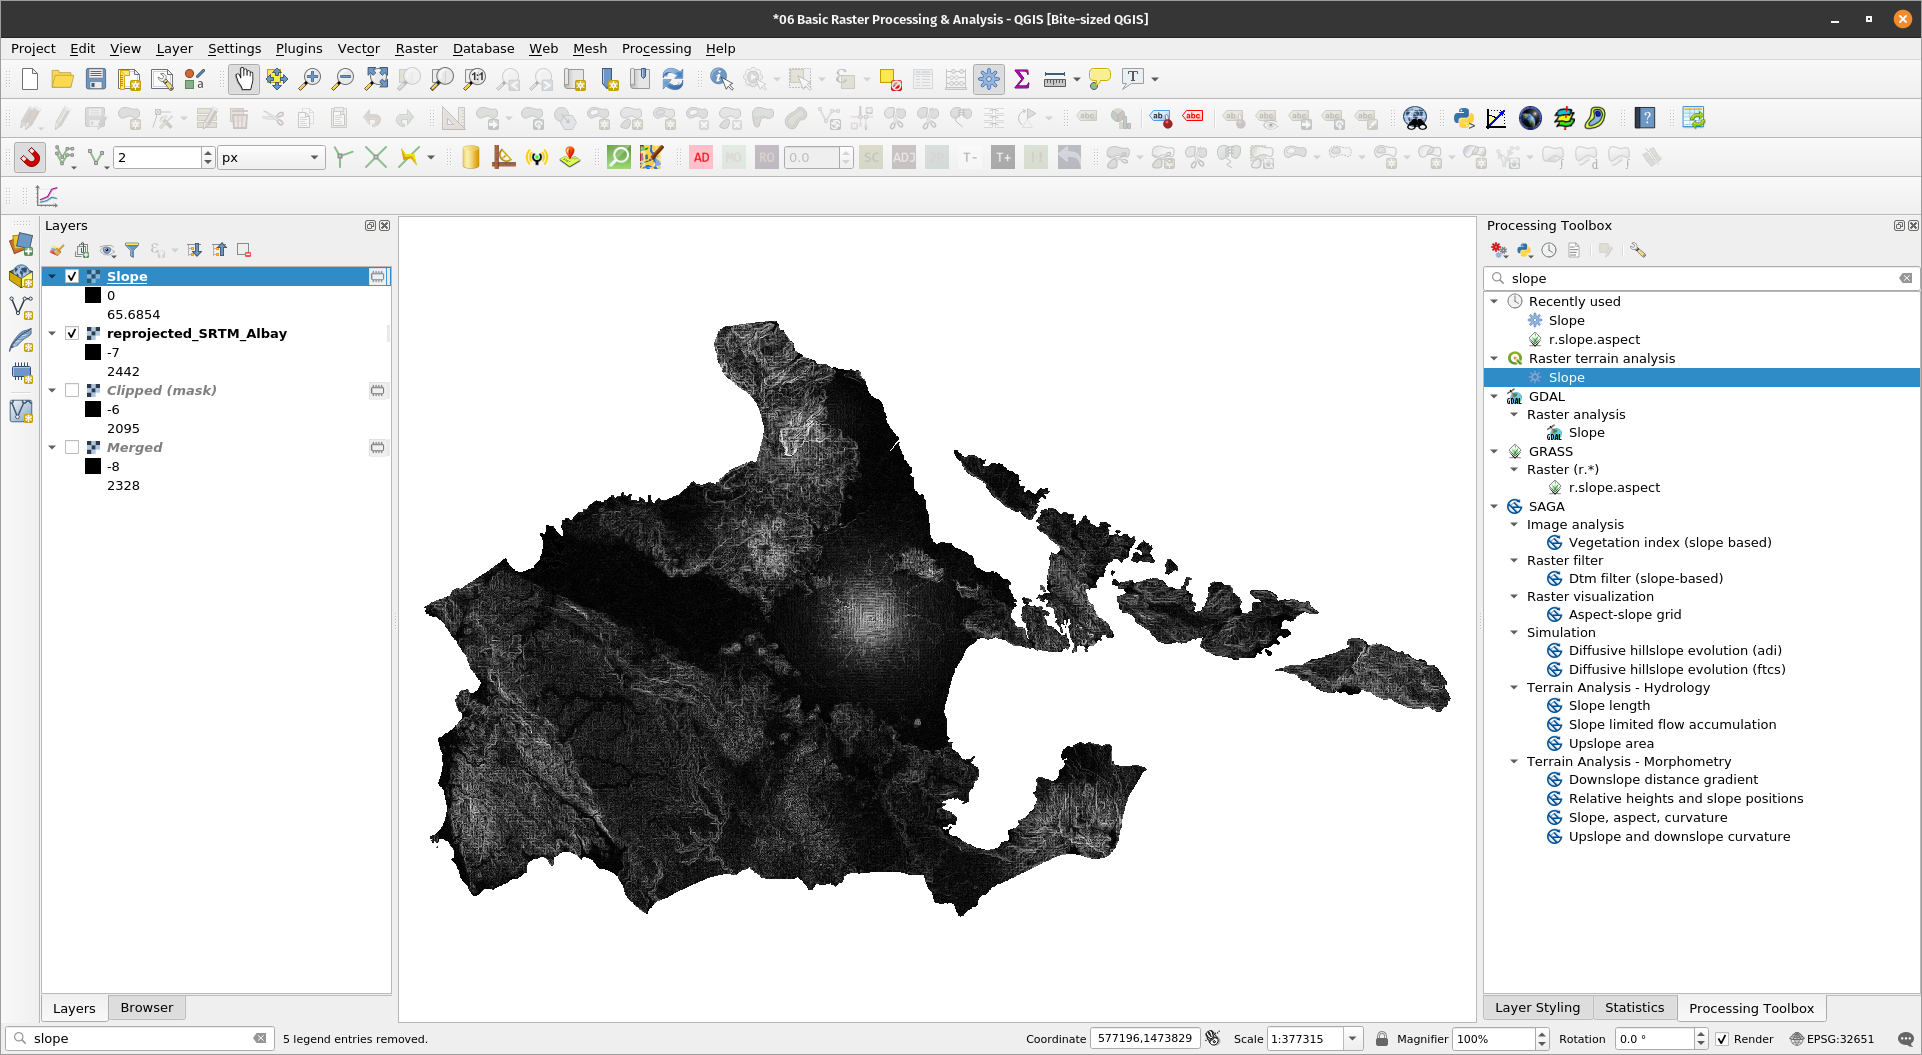
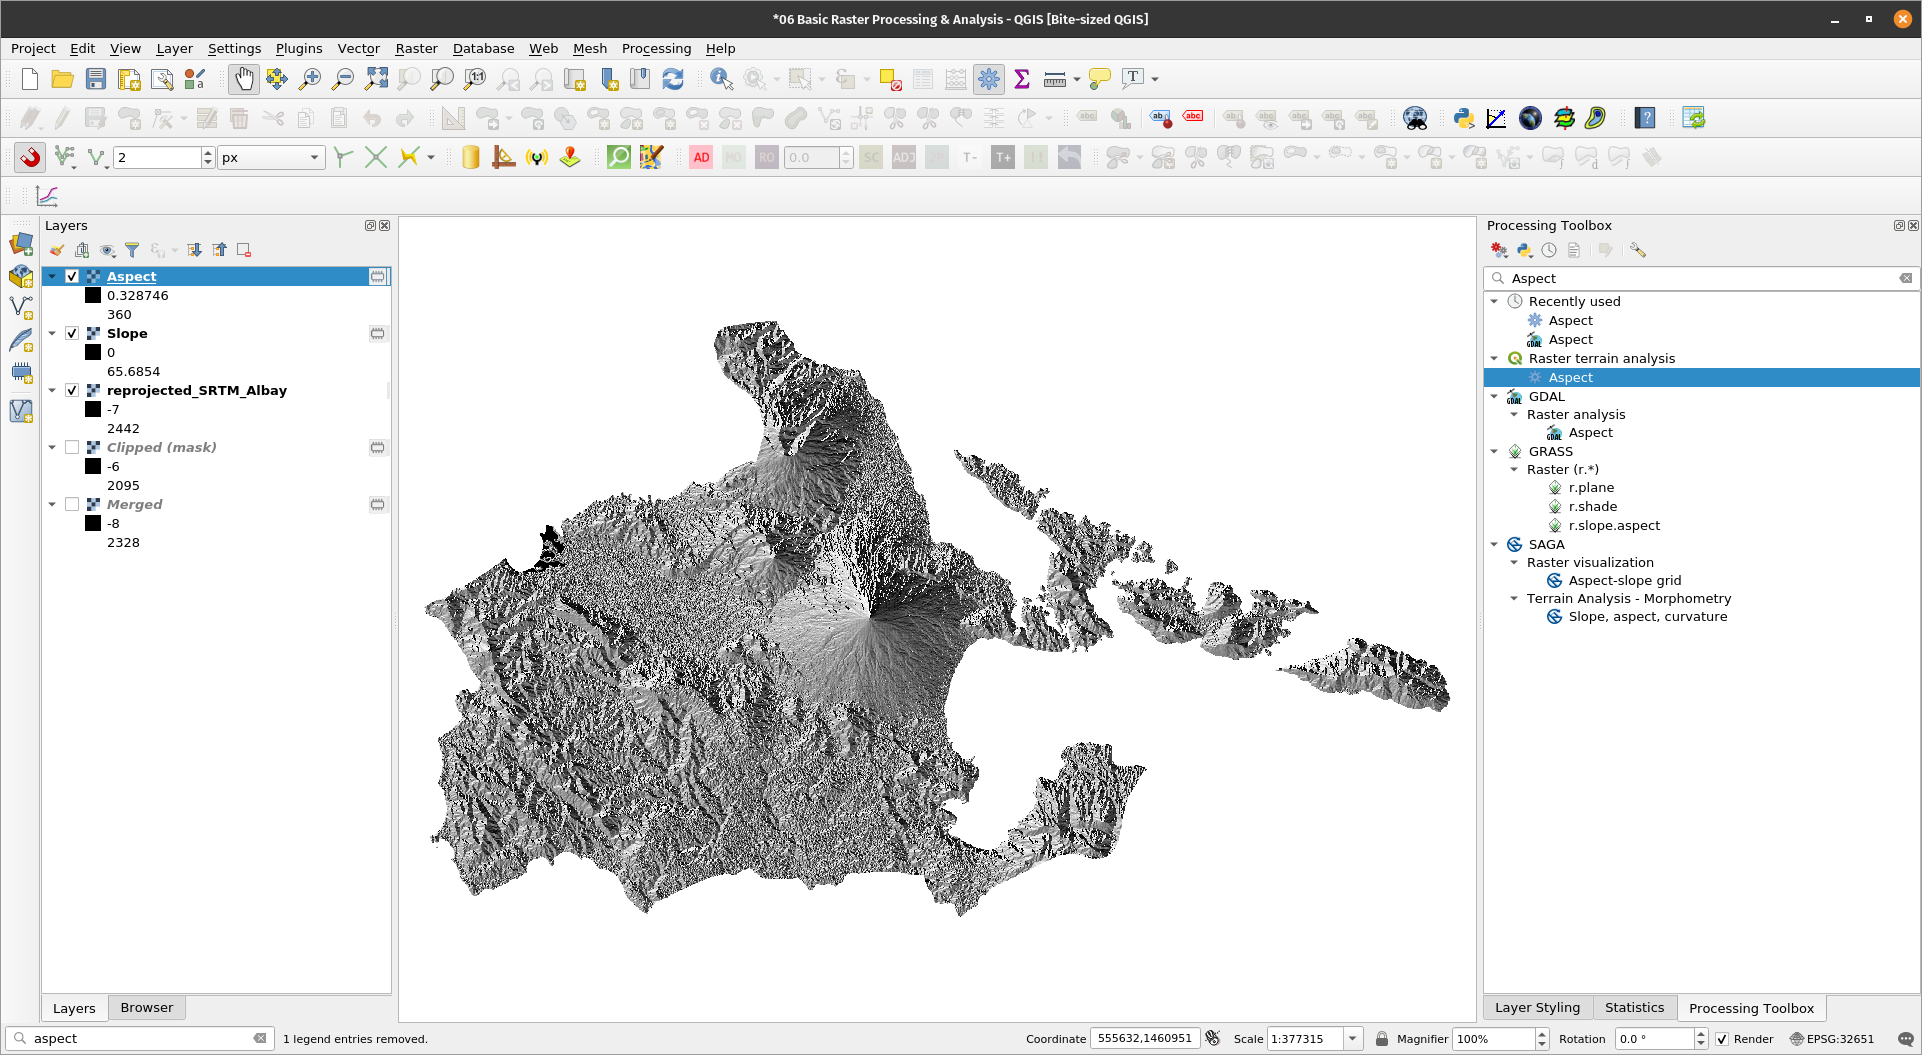
Exercise 6: Computing for the slope and aspectIn the next exercises, we’ll use the DEM of Albay we generated from earlier exercises to compute for the slope, aspect, and solar radiation received in the area. There are several algorithms that can be used to compute the slope and aspect in QGIS. For this exercise, we’ll use the default GDAL computations.
| |
| |
BONUS: Try r.slope.aspect to compute the slope and aspect from the DEM. Are there any differences? | |
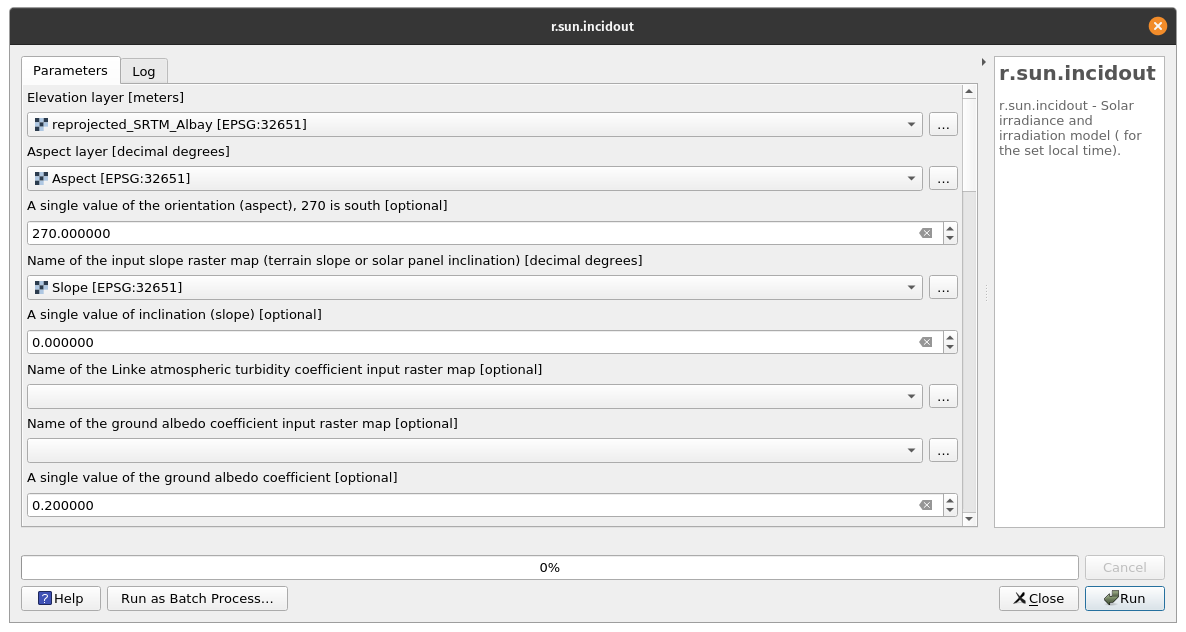
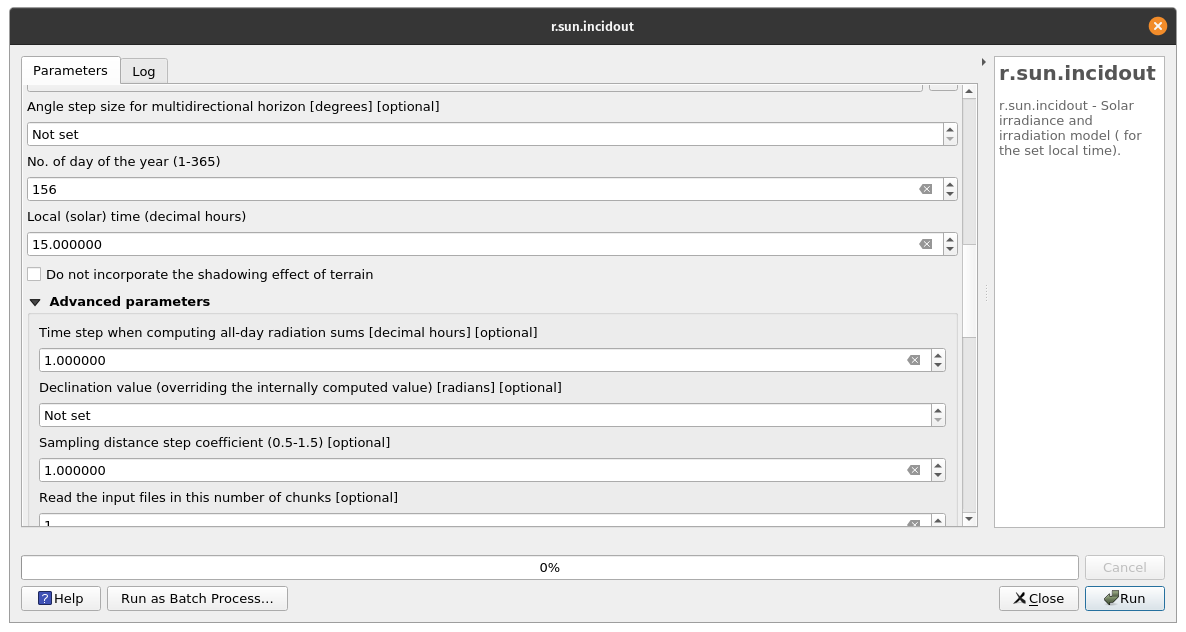
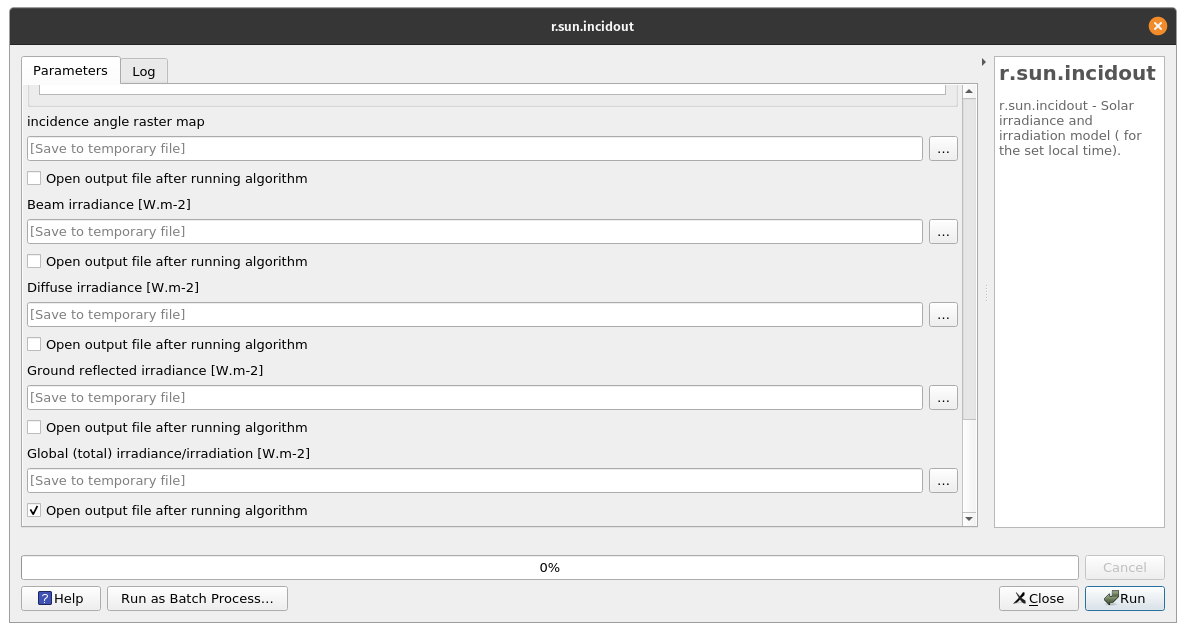
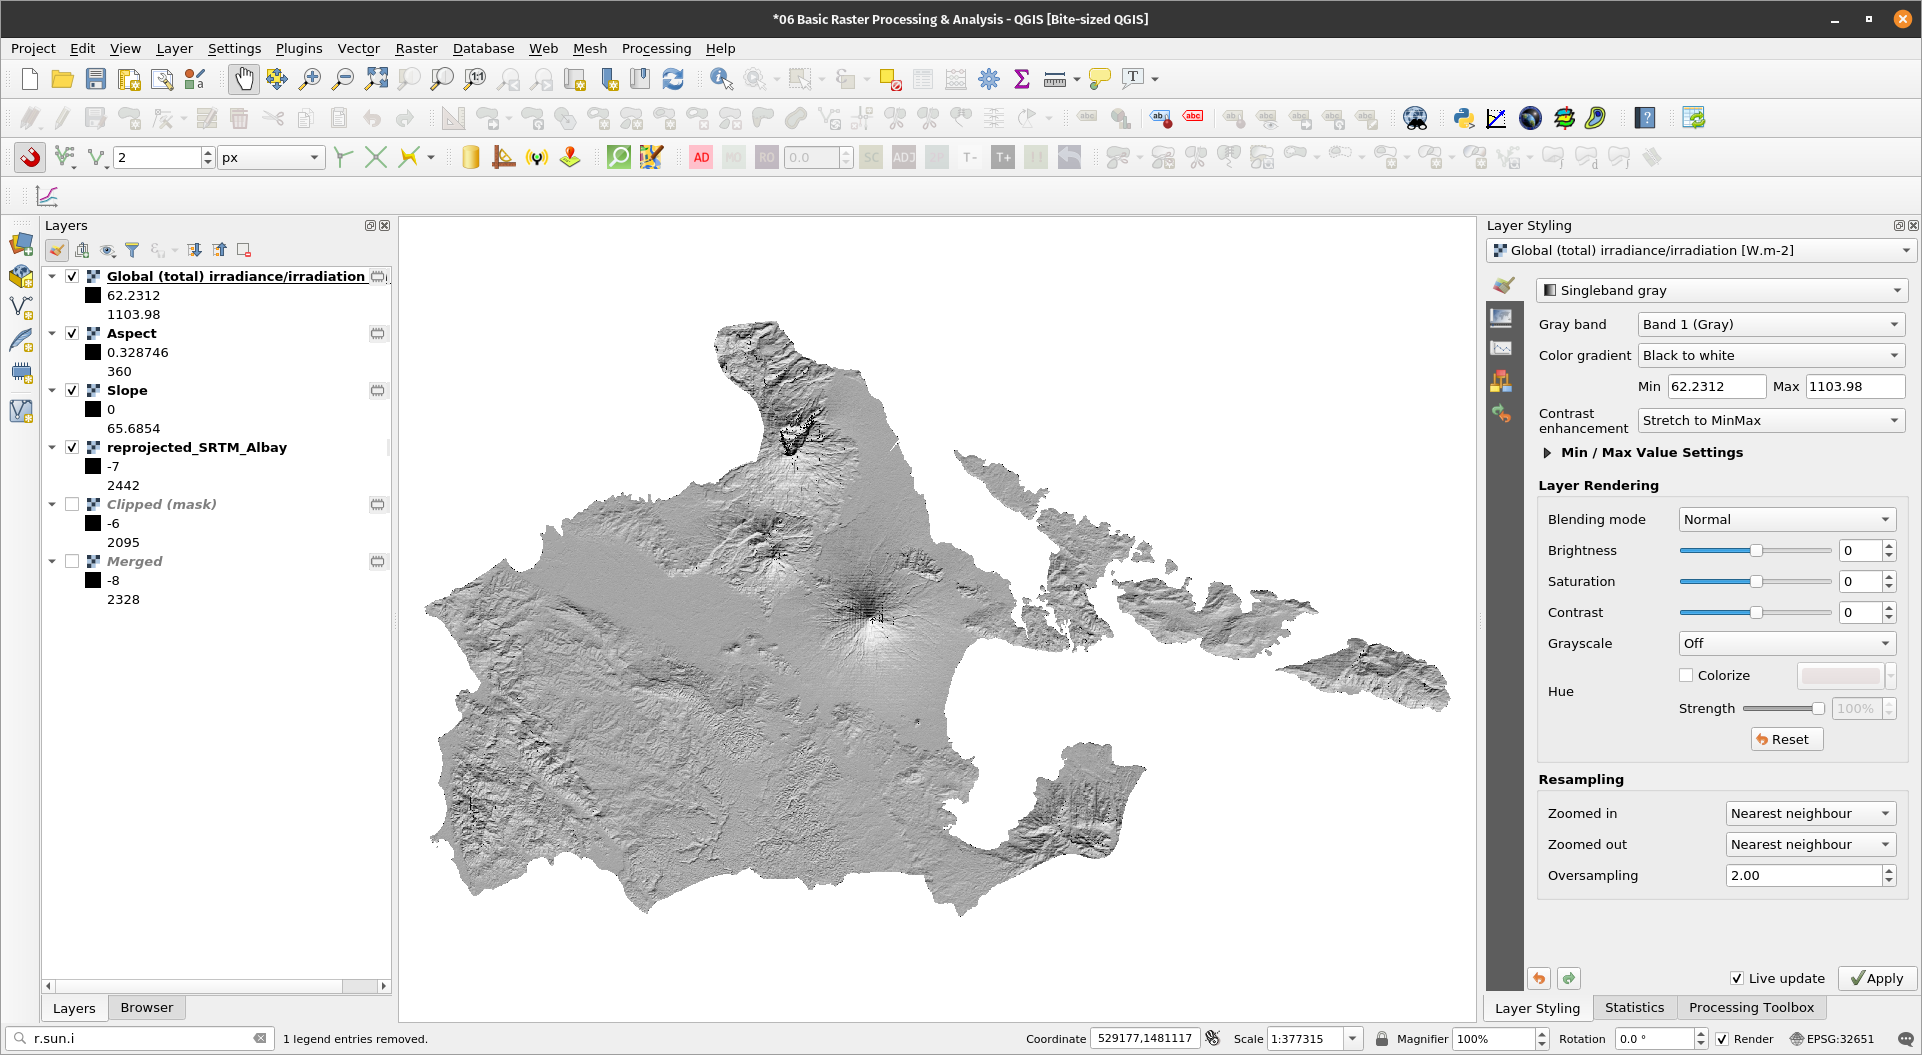
Exercise 7: Computing for the solar radiation/insolationQGIS has access to GRASS and SAGA algorithms such as the solar radiation algorithms of GRASS - r.sun.*. In this exercise, we’ll generate the clear-sky Global Horizontal Irradiance (GHI) for the province of Albay for June 5, 3PM using the elevation, slope, and aspect rasters with the r.sun.incidout algorithm. | |
| |
| |
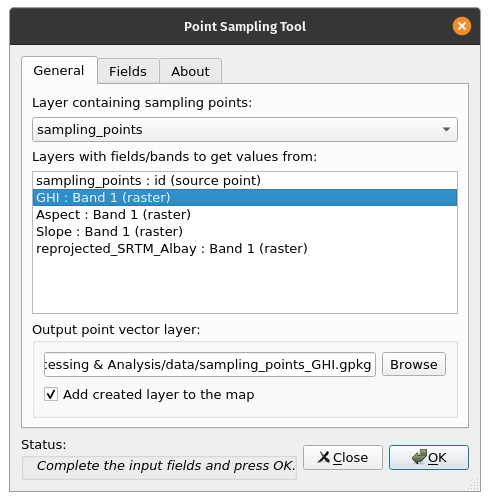
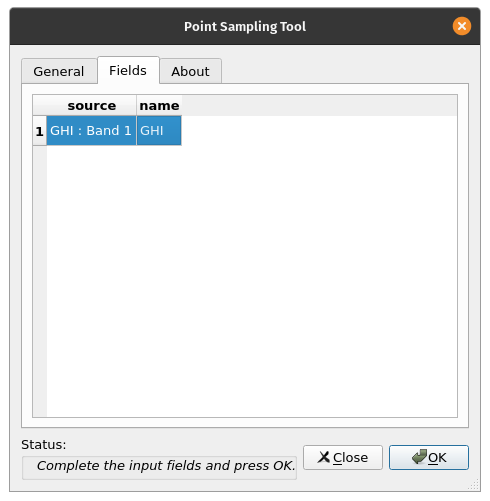
Sampling rasters at pointsExercise 8: Getting solar radiation values at points using the Point Sampling ToolIn this exercise, we’ll use the Point Sampling Tool plugin to get the solar radiation values at each of the sample points.
| |
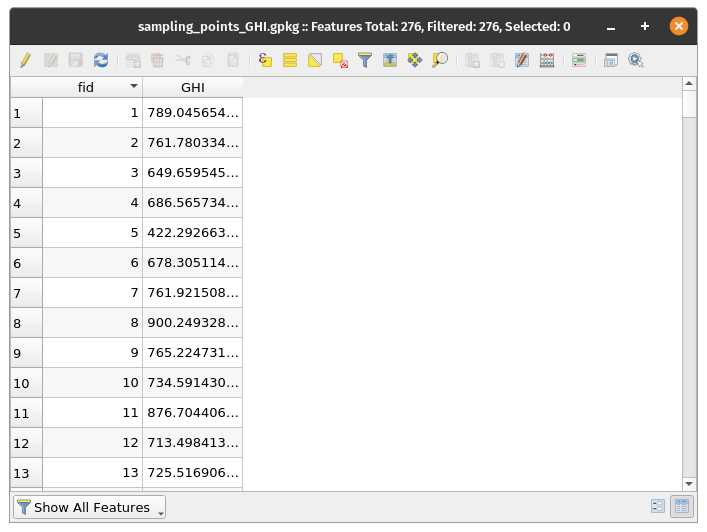
If you check the attribute table of the created point vector, it should have a field for GHI values. BONUS: The Point Sampling Tool works for both Vector and Raster Layers. Just make sure that the layers are visible (checked) in the Layer Panel. Try to use the v.what.rast and/or v.what.vect GRASS algorithms. | |
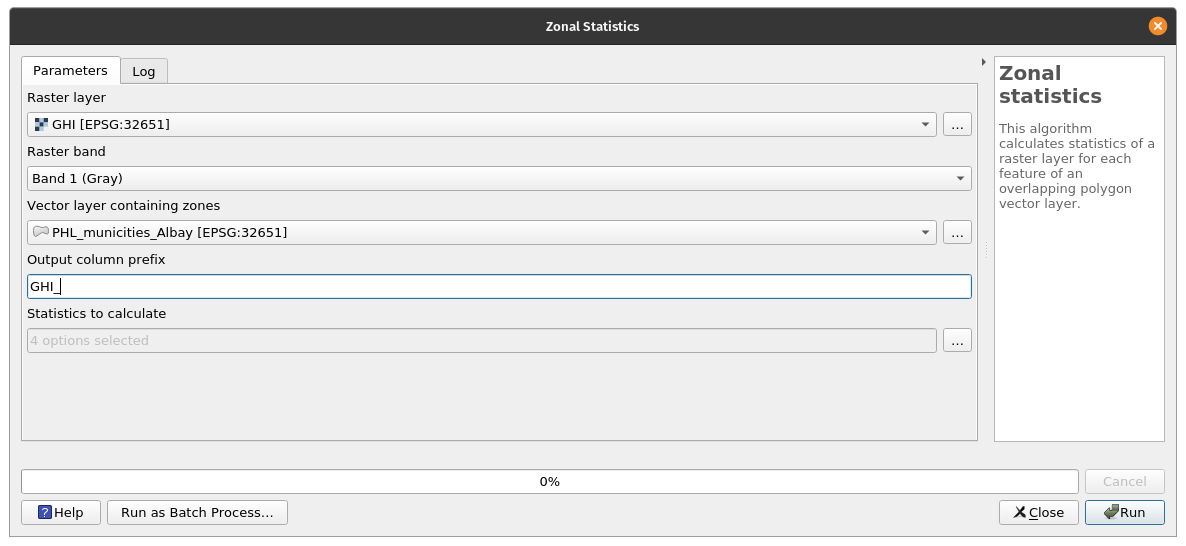
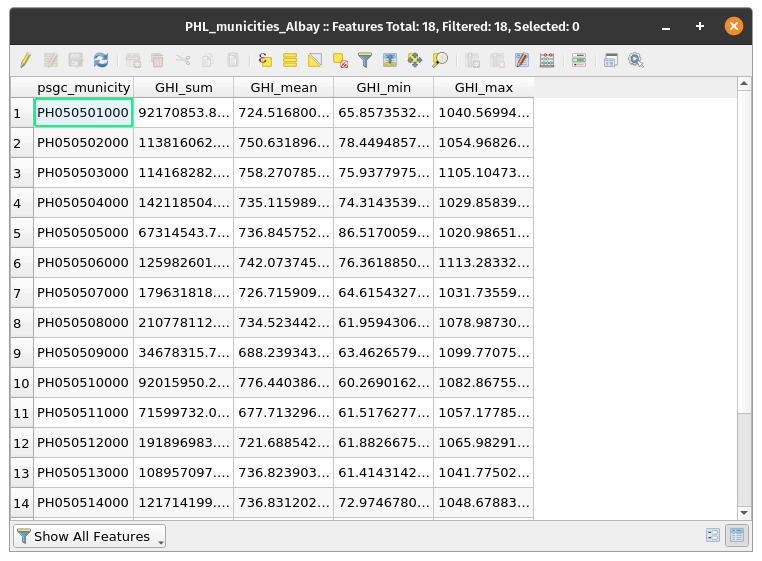
Getting zonal statisticsExercise 9: Getting the average solar radiation values per city/municipality using Zonal StatisticsPolygons can be used to compute zonal statistics based on raster values. For this exercise, we’ll use the Zonal Statistics algorithm to compute the sum, mean, min, and max GHI for the different cities/municipalities.
| |
BONUS: Try to use the other zonal statistics algorithms available in QGIS (e.g. v.rast.stats in GRASS) | |
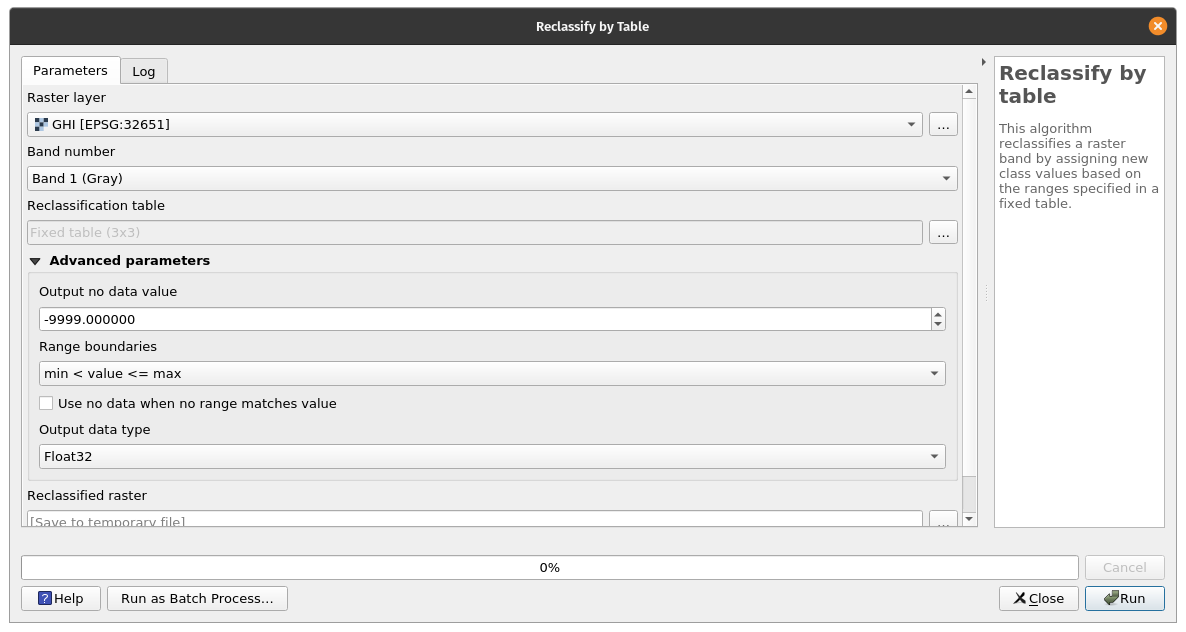
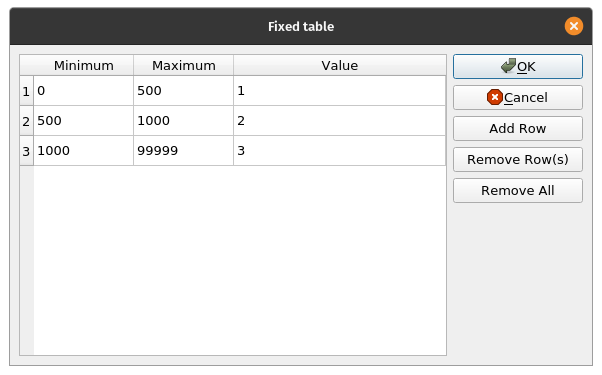
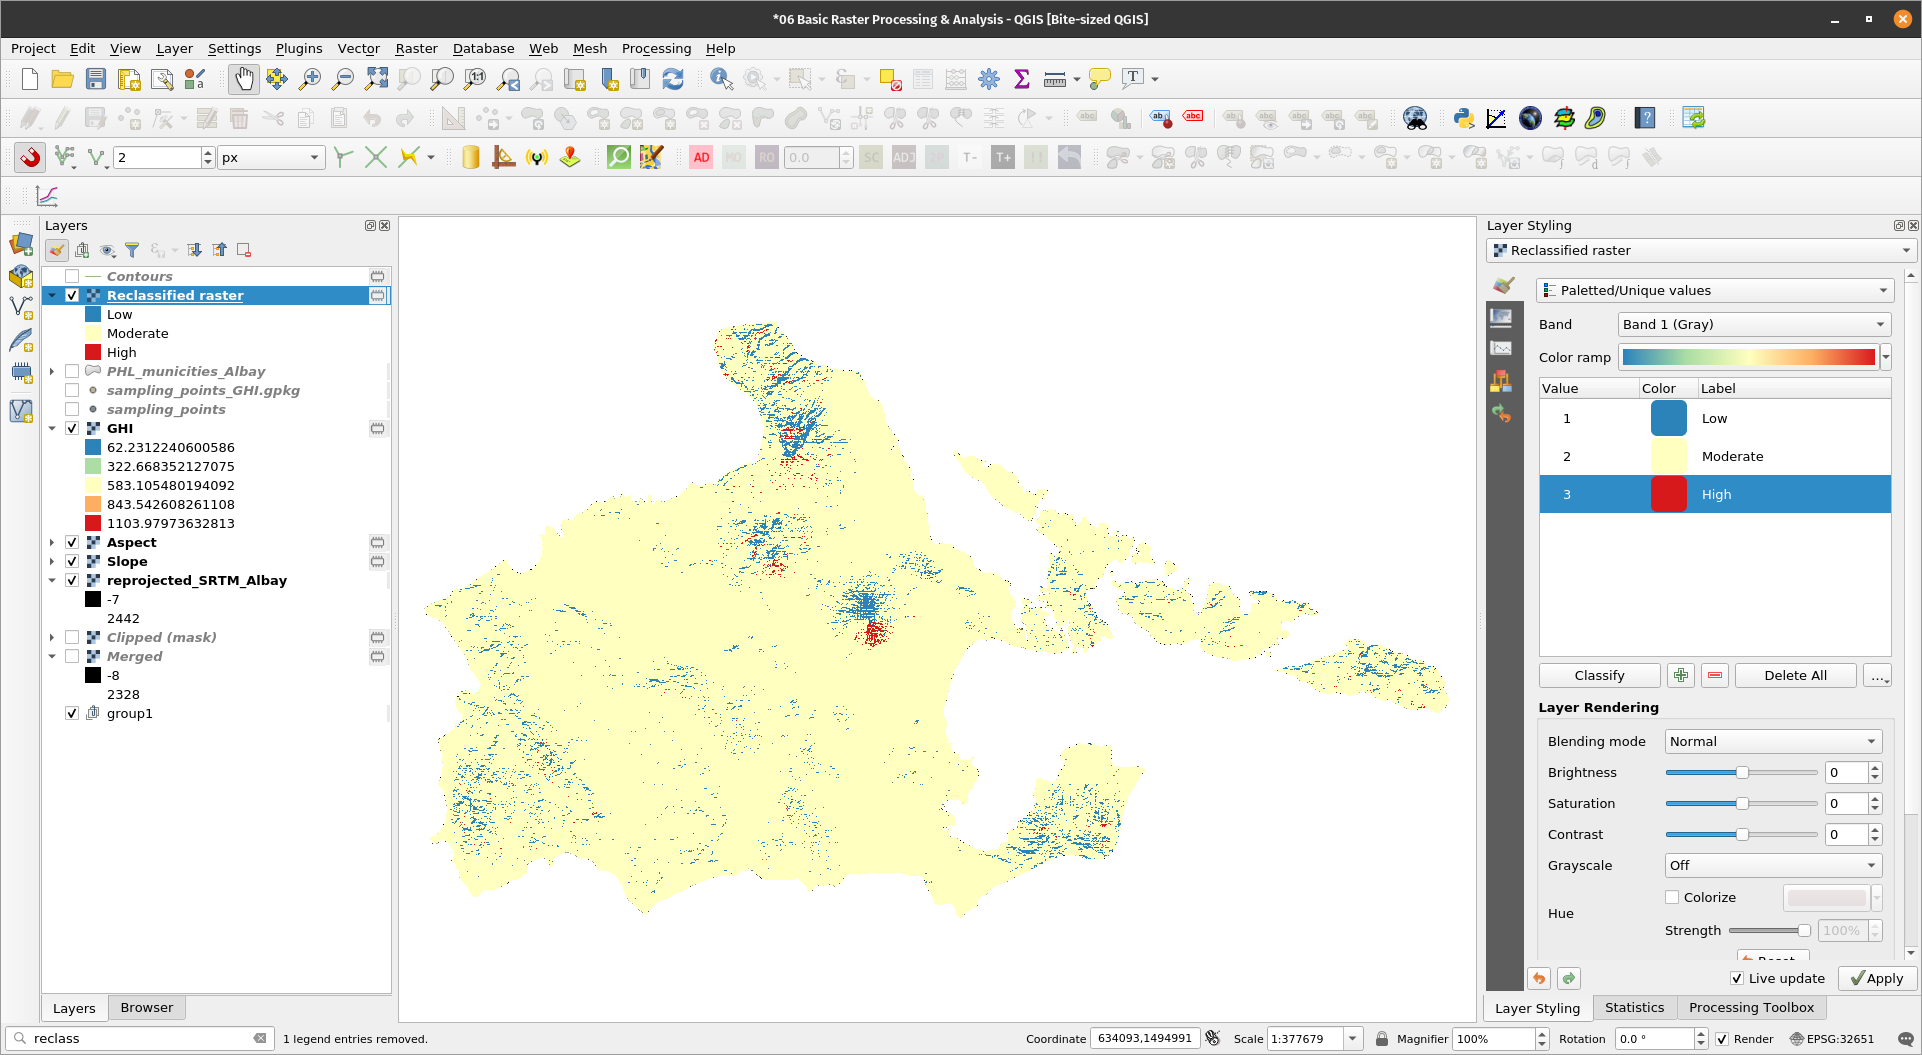
Reclassification is the process of changing the value of a raster pixel based on its existing value. This is useful when creating categorized rasters. In this exercise, we will reclassify the GHI raster into low, medium, and high values (1, 2, 3) based on the current GHI value of the pixel. Exercise 9: Reclassifying the GHI raster
| |
BONUS: Reclassify the Slope raster as well. Have values < 20 be equal to 1 and values > 20 be equal to 0. BONUS: Try the other reclassification algorithms in QGIS. | |
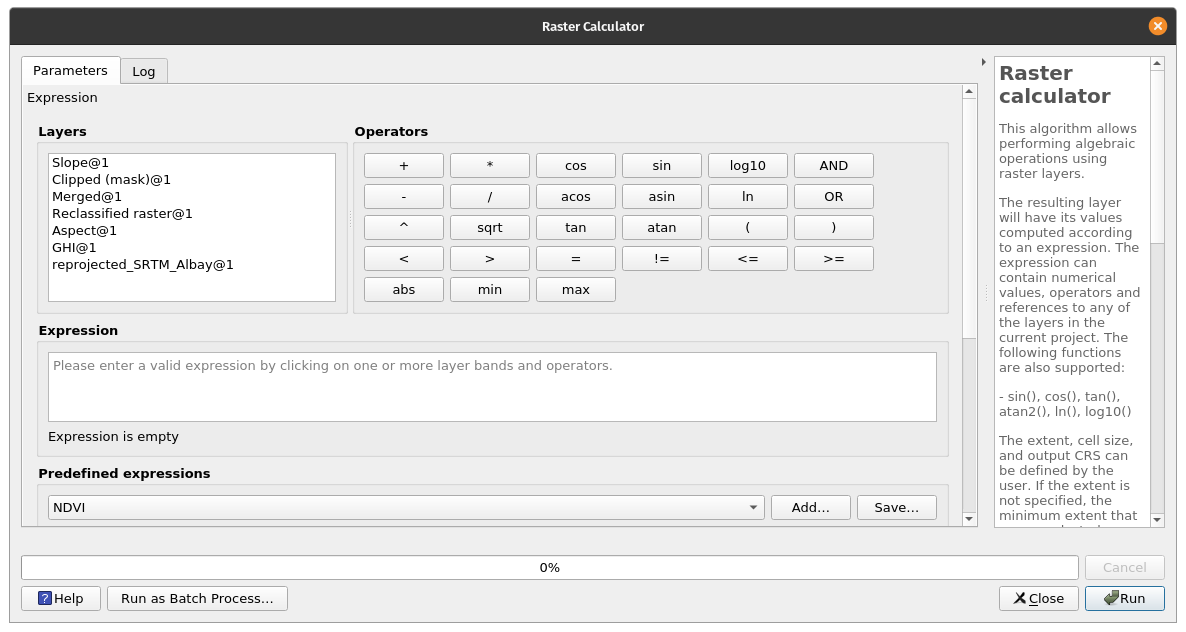
The Raster Calculator is one of the most useful tools in QGIS when working with rasters. Aside from raster arithmetic, it also allows for boolean operations, comparisons, etc. In fact, you can use the Raster Calculator to reclassify rasters if you use the proper expressions. Weighted overlay analysisExercise 10: Using the raster calculator
| |
| |
This work and its contents by Ben Hur S. Pintor is licensed under a Creative Commons Attribution-NonCommercial-ShareAlike 4.0 International License. |