GIS-curriculum
Module 1 - Introduction to QGIS
Author: Ben Hur
Pedagogical Introduction
This module serves as an introduction to QGIS. At the end of this module, learners should be familiar with:
- what QGIS is
- QGIS interface
- QGIS settings
- QGIS plugins
They should also learn:
- how to install and open QGIS
- the different parts and features of the QGIS interface
- how to edit the interface layout and theme
- the different QGIS settings, how to change them, and how they affect QGIS
- what user profiles are and how use them
- what plugins are and how to install them
The module will also discuss some nuances of QGIS and what makes it unique or different from other GIS such as QGIS file formats.
Required tools and resources
The required tools and resources for this module are:
- working computer
- internet connection
- QGIS 3.16 installed in the computer (https://qgis.org/en/site/forusers/download.html)
Prerequisites
- basic knowledge of operating a computer
Additional resources
- QGIS User Guide - https://docs.qgis.org/3.16/en/docs/user_manual/
- QGIS Training Manual - https://docs.qgis.org/3.16/en/docs/training_manual/index.html
Thematic introduction
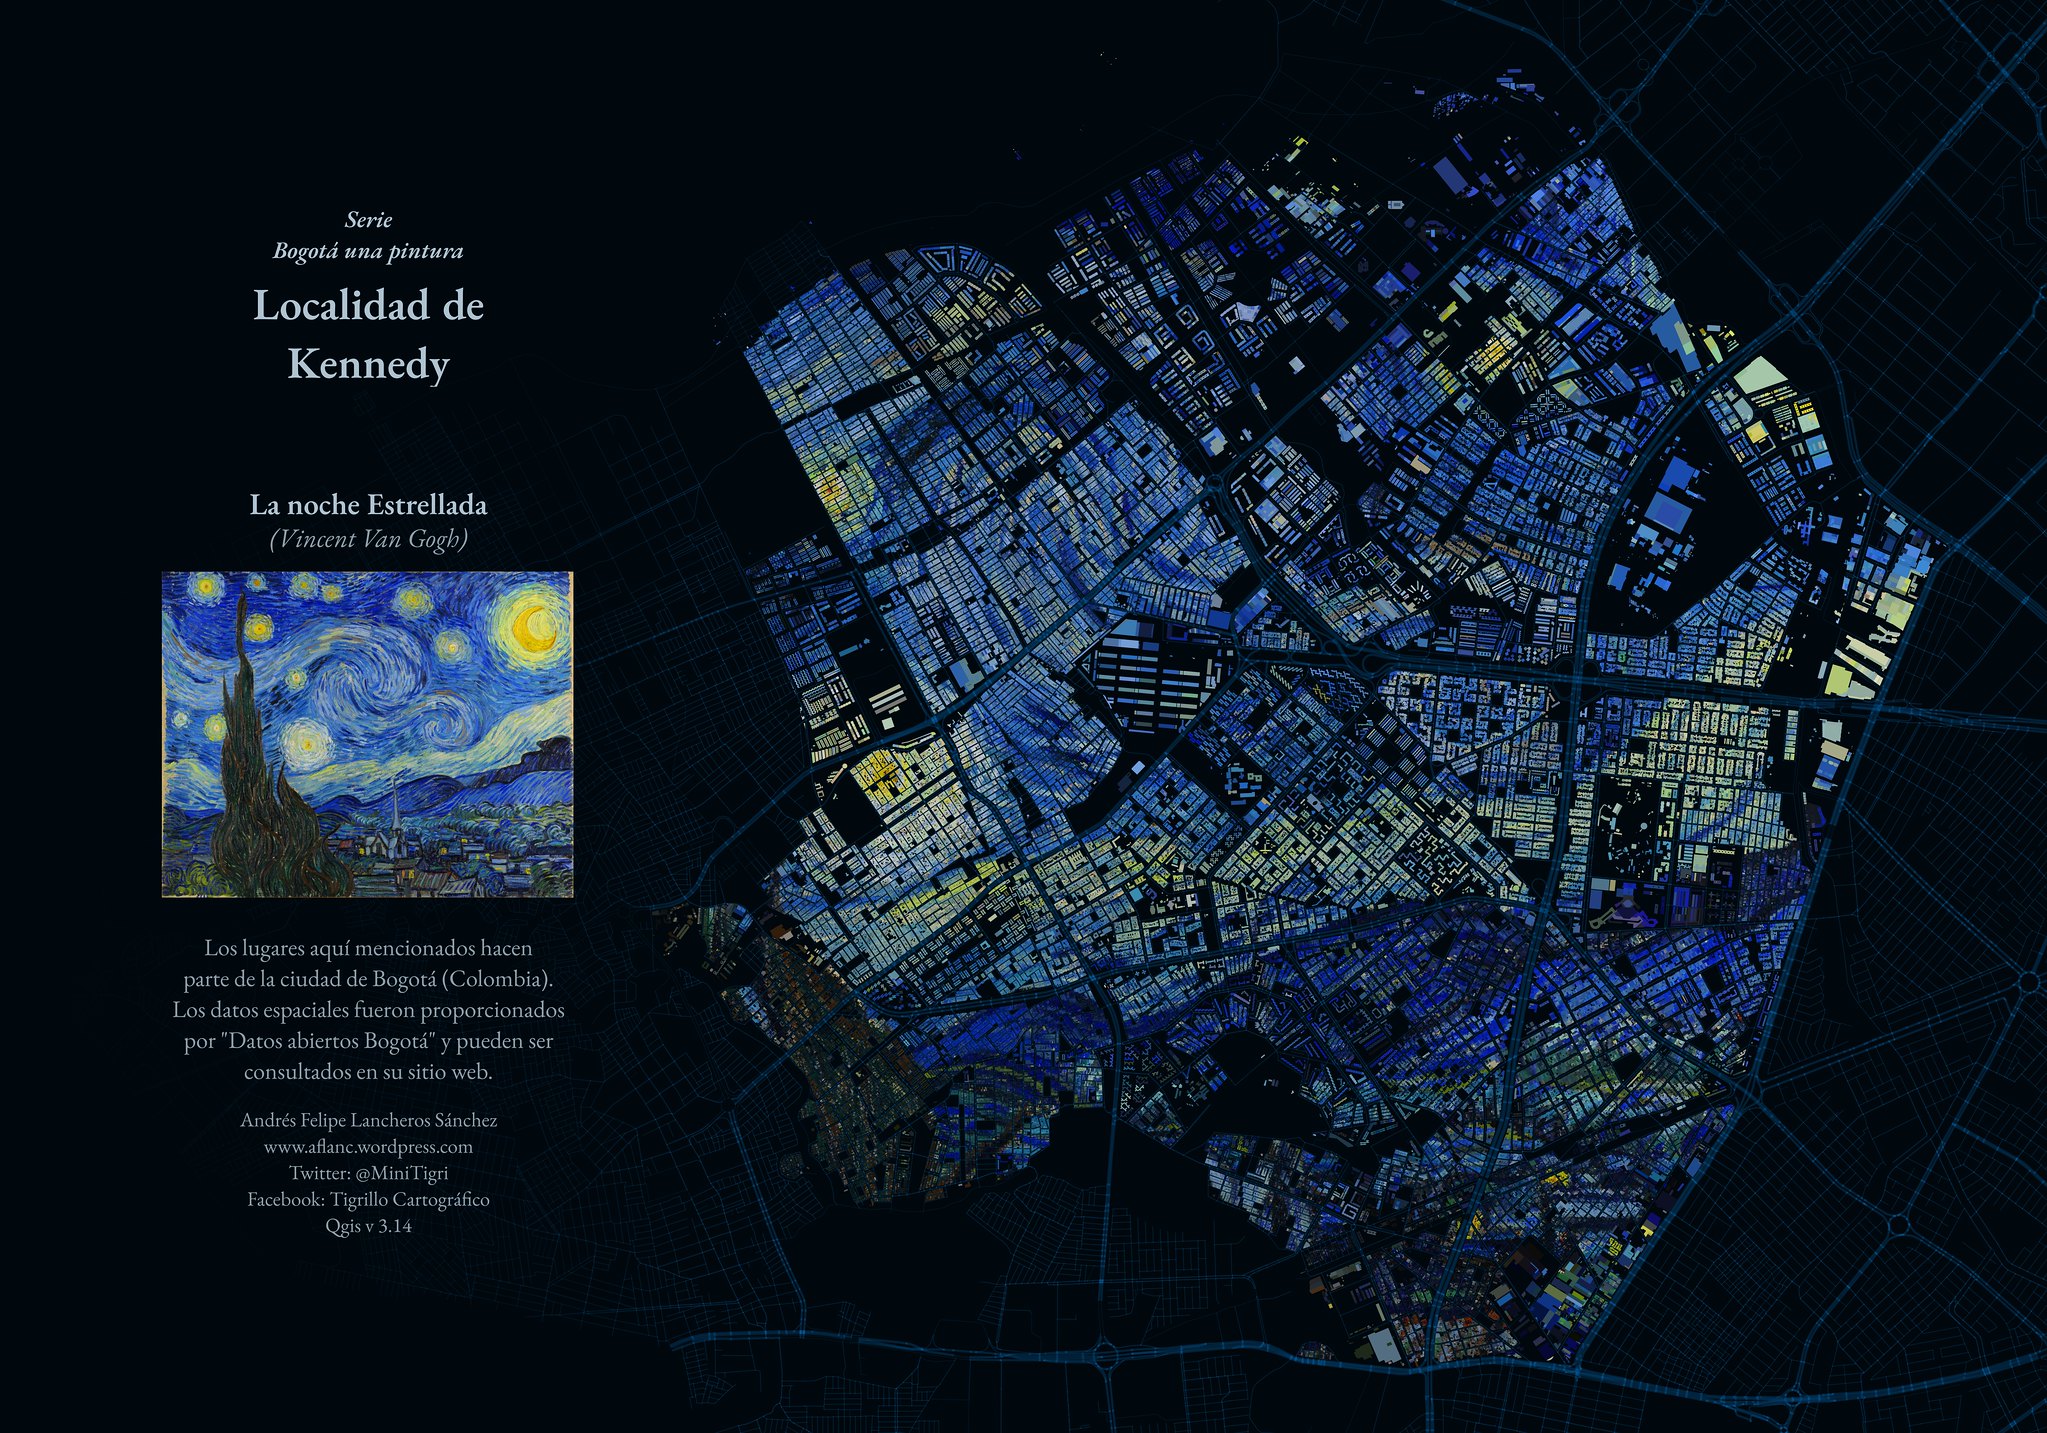
The map below (https://flic.kr/p/2jFfGJP) shows parts of the City of Bogota in Columbia made in the style of Vincent van Gogh’s “Starry Starry Night” by Andrés Felipe Lancheros Sánchez.
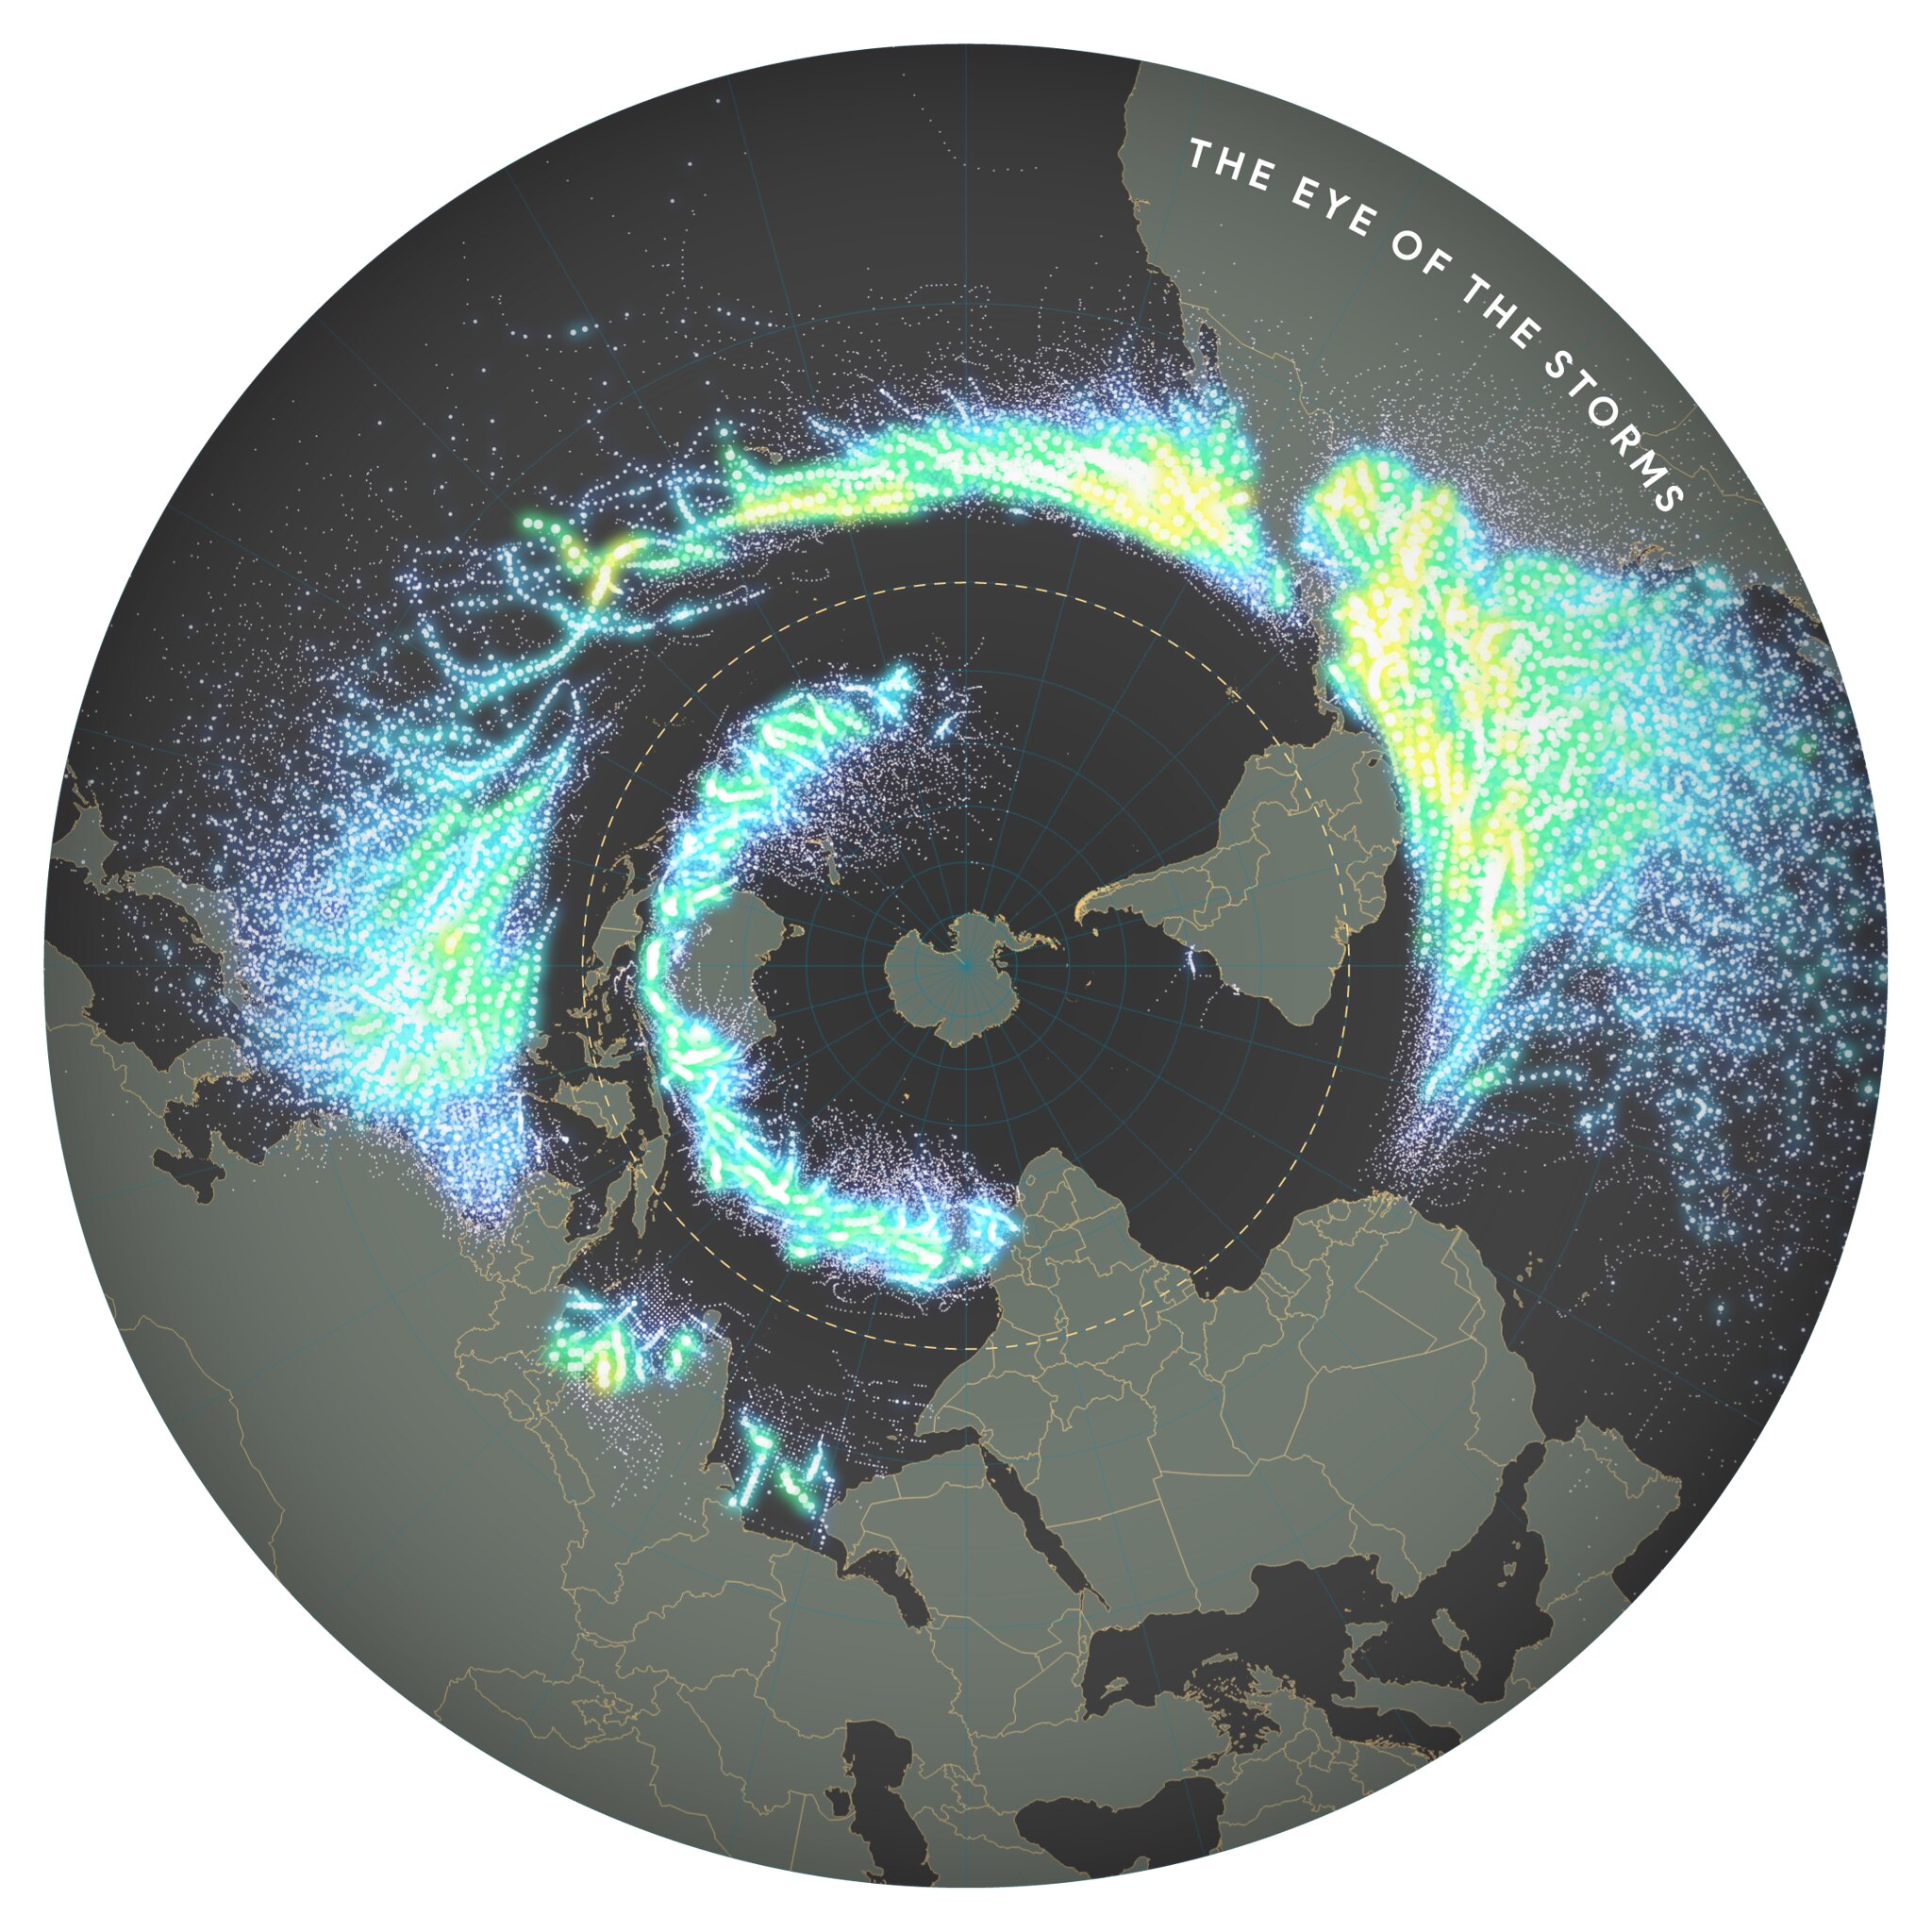
This next map (https://flic.kr/p/2jAsphv) shows storm trace data from NOAA between 1851 to 2020 made by Fajr Alim.
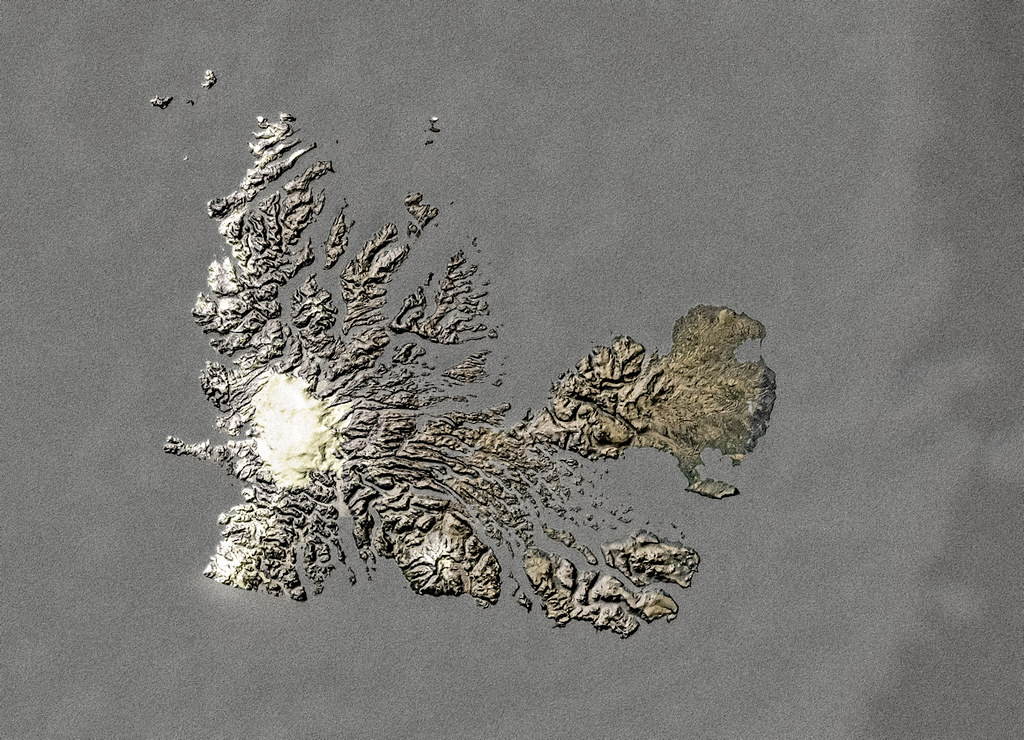
This next one (https://flic.kr/p/FA9TiR) is a map of Kerguelen Island by Heinrich Lingnau Schneider.
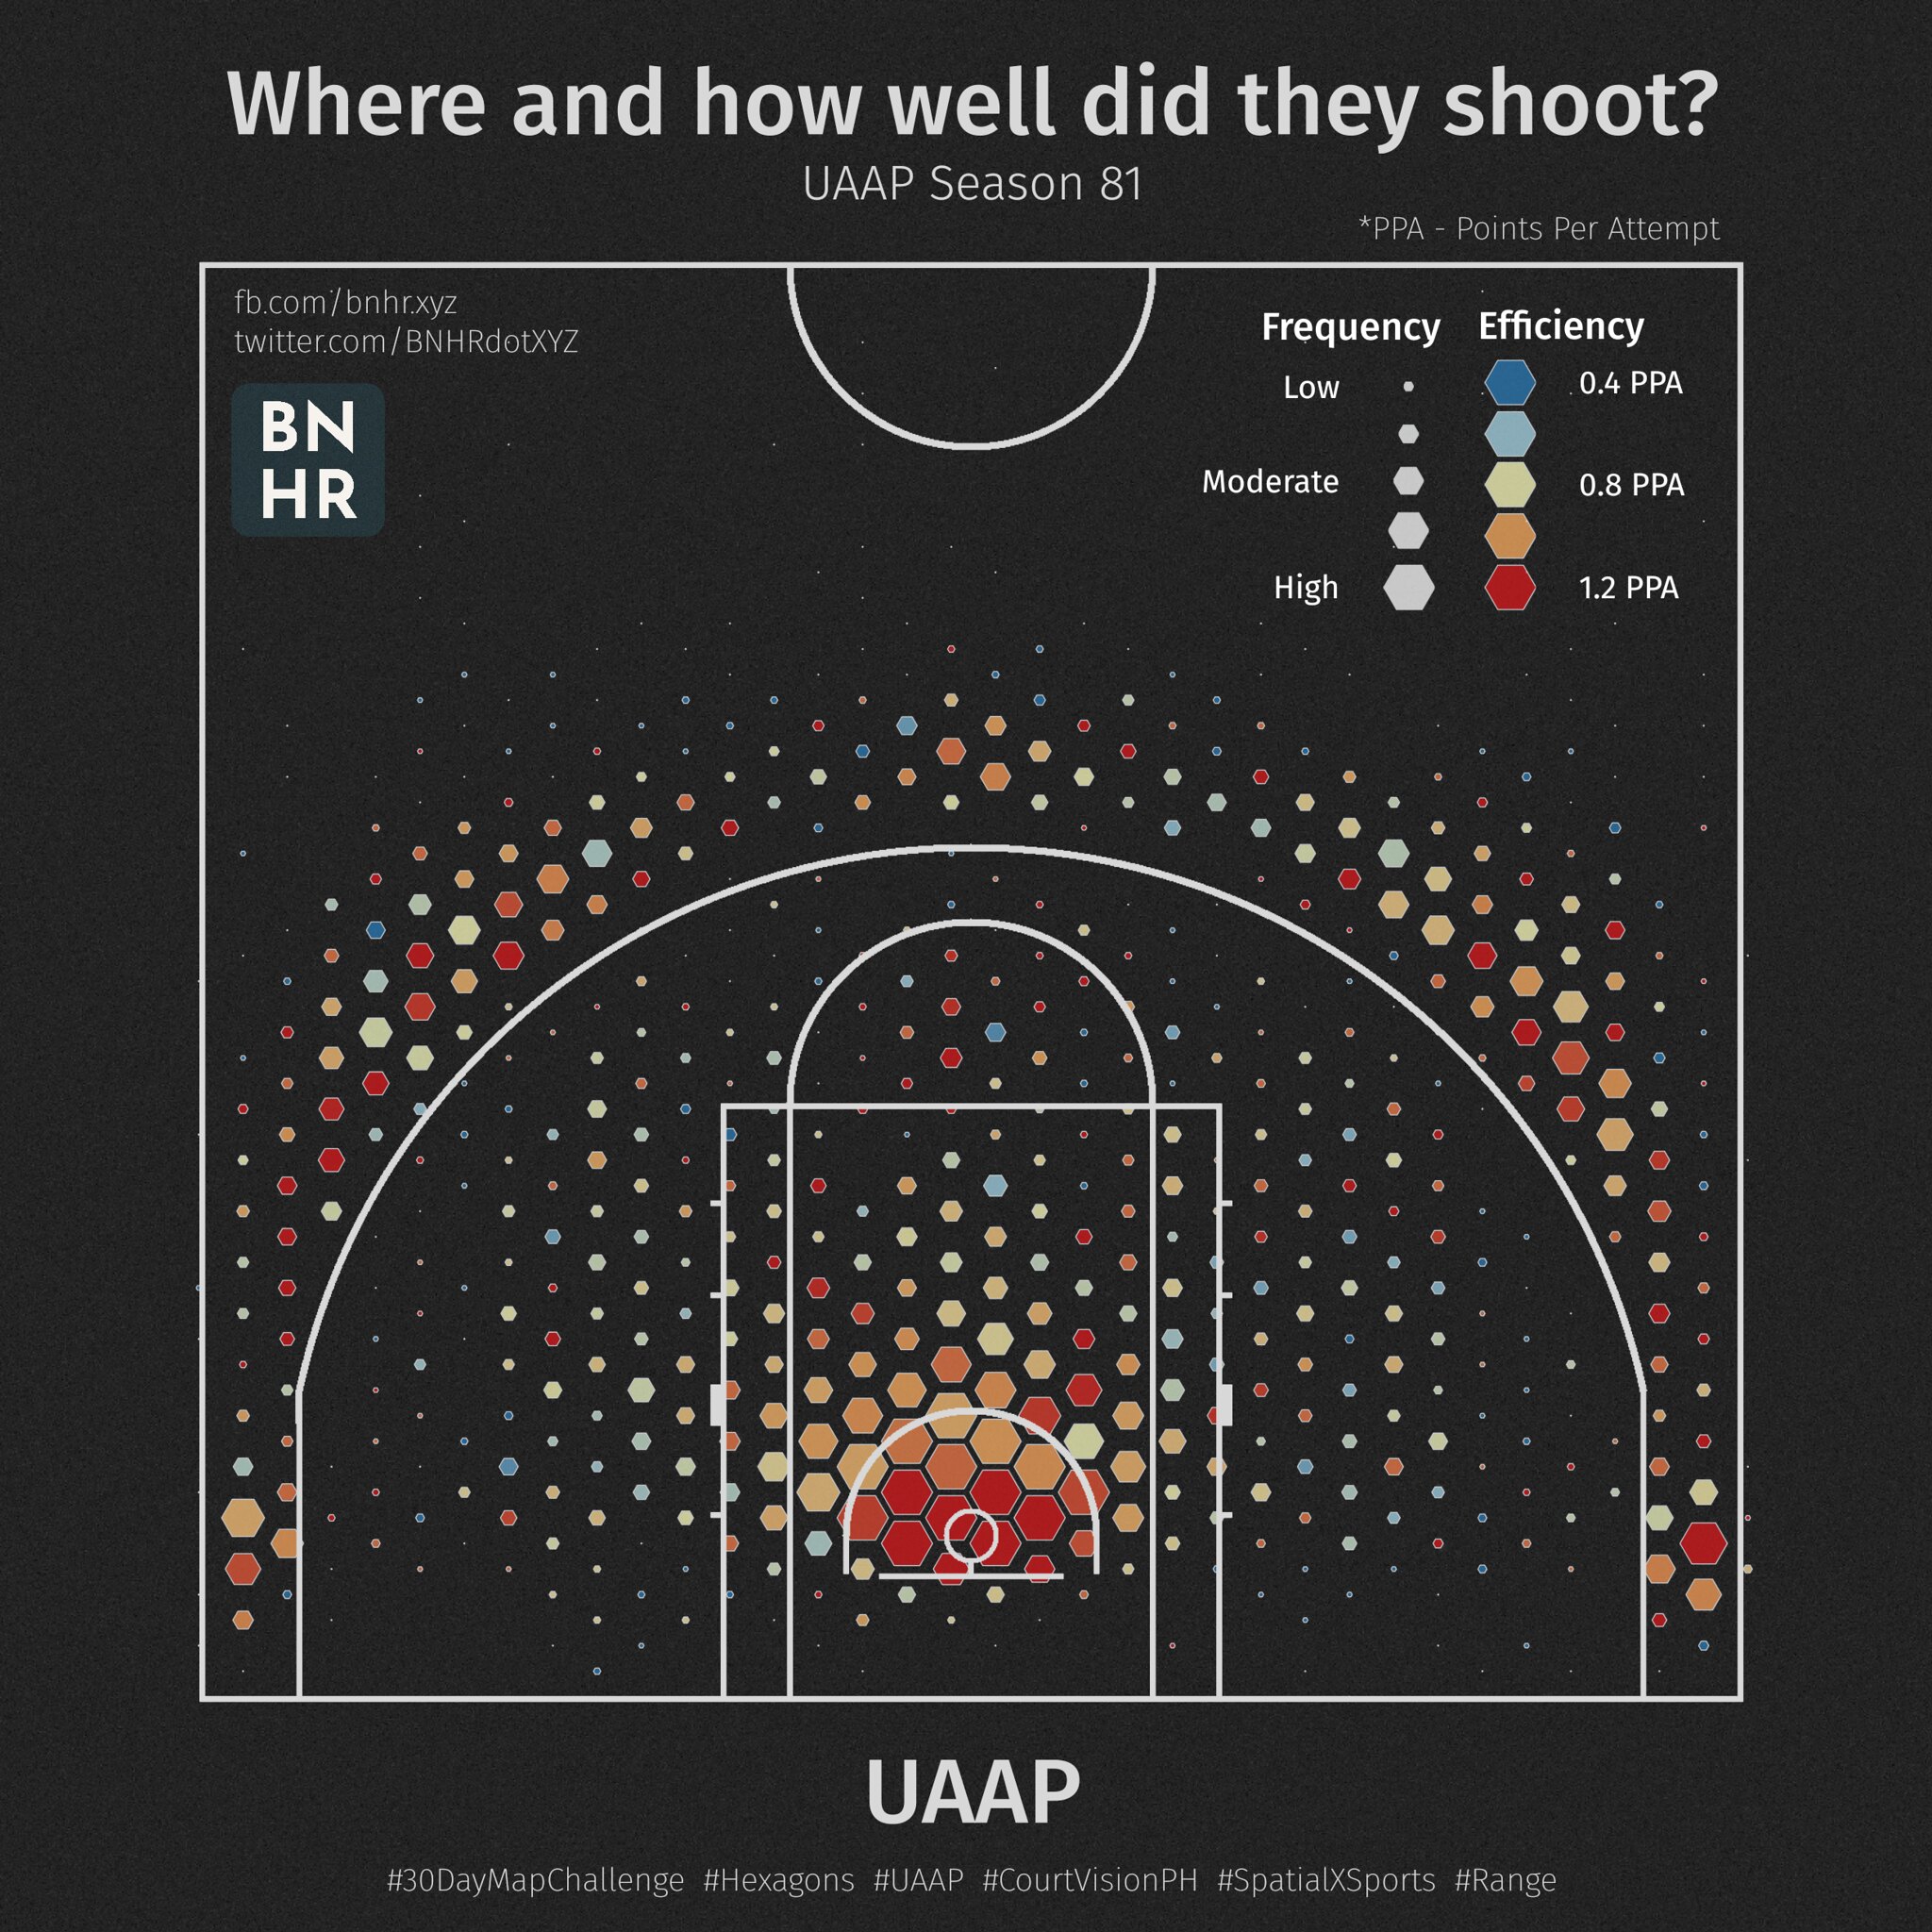
This last one (https://flic.kr/p/2kqVzsg) is of field goal attempts and points scored per attempt during the UAAP Men’s Basketball Tournament Season 81 in the Philippines by Ben Hur Pintor.
What do all these maps have in common? For one, they were all made using QGIS.
Breakdown of the concepts
The maps shown above were all created in QGIS (https://qgis.org/en/site/), a free and open source Geographic Information System (GIS). QGIS can be used with all kinds of spatial data (such as basketball data in the last example) and not just with earth-related geospatial data.
People are able to create wonderful and amazing maps such as the examples above because QGIS is free, open source, and has powerful data management, analysis, and presentation capabilities.
Main content
Phase 1 title: Introduction to QGIS and the QGIS Interface
What is QGIS
QGIS, known as Quantum GIS prior to its 2.X release, is a mature, cross-platform, free and open source Geospatial Information System (GIS).
It is an enterprise ready GIS that has features for collecting, storing, analysing, presenting, and managing spatial & non-spatial data. It also integrates well with other existing geospatial technologies and serves as an integral part of any FOSS4G (Free and Open Source Software for Geospatial) stack.
Being cross-platform, QGIS runs on GNU/Linux, macOS, Windows, and even Android.
Release cycle and versions
QGIS releases and development follow a time based schedule/roadmap (https://www.qgis.org/en/site/getinvolved/development/roadmap.html).
A QGIS release is specified by three numbers (X.Y.Z). For example, QGIS 3.16.4.
- X refers to the main version. In this case, QGIS 3.
- Y refers to the release version. In this case release version 16. Release versions are always even numbers since odd numbers are reserved for development versions.
- Z refers to the Point Release (PR) of that version. For 3.16.4, that means it is the 4th point release of the 3.16 version.
There are three main branches of QGIS that users can install. These are the Long Term Release (LTR) branch, Latest Release (LR) branch, and the Development (Nightly) branch.
- Long Term Release (LTR) is named that way because it is maintained and receives bug fixes until the next LTR is released. Currently, that means one (1) year. As of February 2021, the current LTR is 3.16.4. This is scheduled to be replaced by QGIS 3.22.4 in February 2022.
- Latest Release (LR) refers to the release version of QGIS that contains the most recent or latest features. A new LR is released every four (4) months. For example, a new 3.18 LR was released this February 2021. The next LR (3.20) will be released 4 months from now which is in June 2021. Currently, every 3rd LR becomes the next LTR. For example, the LTR this February 2021 is the 3.16 release. The 3rd LR from 3.16 is 3.22 therefore the next LTR will be based on the 3.22 release version.
- Development/Nightly is based on the most recent version of the QGIS source code but is useful if you want to test, debug, or help in the development of QGIS.
So which version should you use? It depends. If you need a version that is maintained for a longer time and you don’t necessarily need new features as they are released then the LTR version might be for you. If you need to have the most recent features and don’t mind doing an upgrade every few months, the LR version just might be for you. Sometimes it’s also good to take a look at the development or nightly versions especially if you are curious or excited about the upcoming features in QGIS.
For more information, visit: https://bnhr.xyz/2020/10/26/about-qgis-versions-release-cycle-english.html
Examples of QGIS maps in the wild
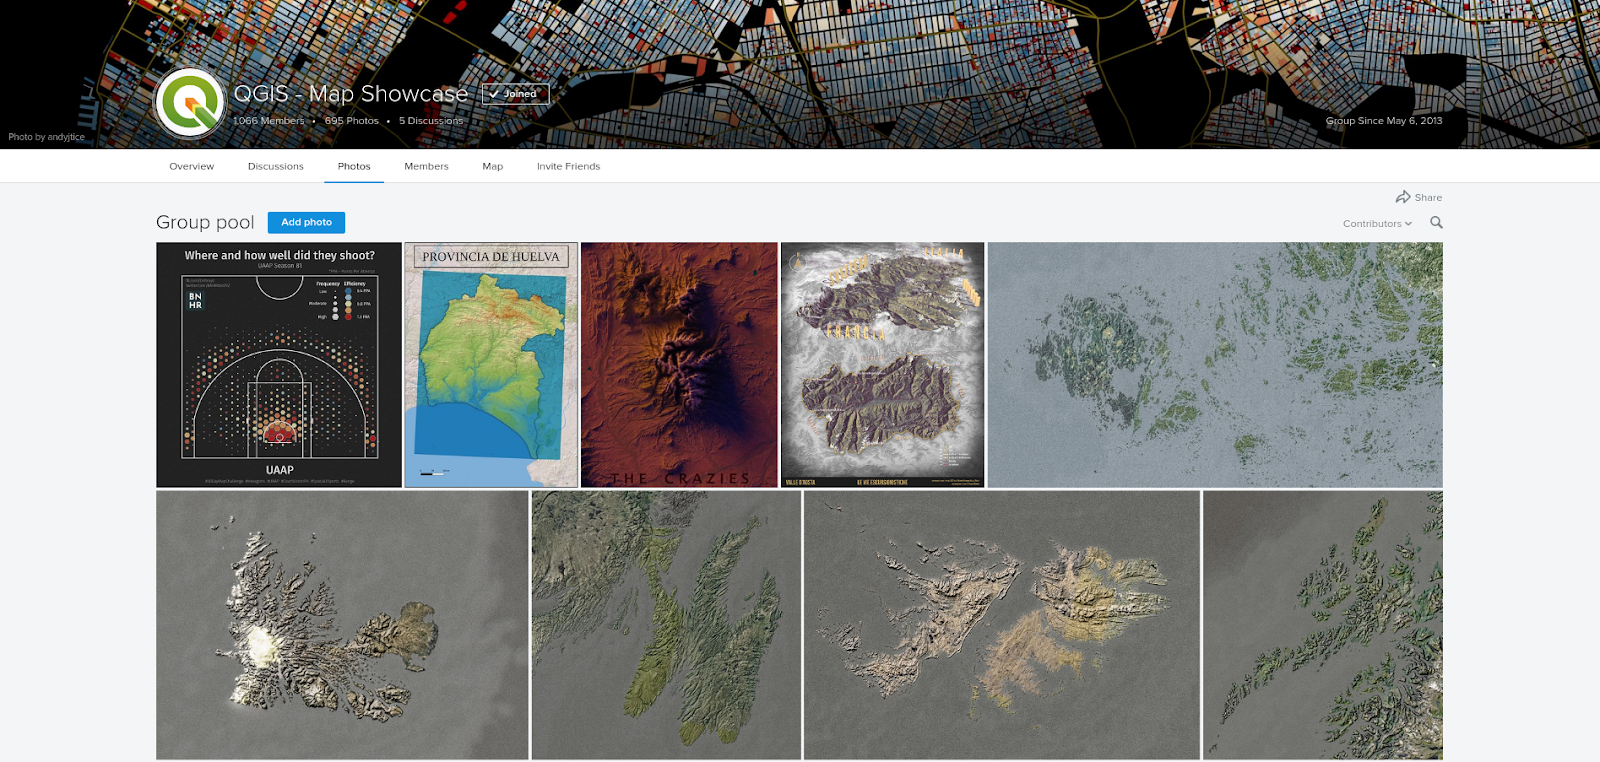
Figure 1.1. QGIS Map Showcase
For more maps created with QGIS, visit: https://www.flickr.com/groups/2244553@N22/pool/with/50355460063/
Installing QGIS
QGIS is cross-platform and works on Linux, Windows, and macOS. Being open source, you can build and install QGIS from its source code available at https://github.com/qgis/QGIS/.
Installers and installation instructions are also available at https://qgis.org/en/site/forusers/download.html or https://qgis.org/en/site/forusers/alldownloads.html.
For Linux (or GNU/Linux), QGIS is usually available from your distribution’s package manager. For Debian/Ubuntu users, QGIS has repositories for the LR, LTR, and Development branches as well as versions of QGIS with dependencies from the ubuntugis-unstable PPA. QGIS is also available as a Flatpak package or in Conda.
For Windows, users can choose between the OSGeo4W Network Installer or the Standalone installers. There’s one Standalone installer for the LTR and LR version.
The Standalone installers are the easiest to install and are recommended for beginners. Multiple versions of QGIS can be installed in your computer at once. This means that you can have both the QGIS 3.16 and 3.18 versions installed.
The OSGeo4W Network Installer is a bit more advanced and complex than the standalone installers but it also gives you the ability to update and upgrade your QGIS version in-place which means that you won’t need to uninstall an older version if you want to install a newer one.
In some cases, you would need administrator rights to install QGIS so if you are installing it on a computer where your user does not have administrator rights, you might need to ask your IT or office administrator to install QGIS for you.
The installation in Windows also comes with QGIS with GRASS (another Free and Open Source GIS).
Note that QGIS is slowly removing 32-bit support for Windows so it is best to install QGIS on a computer that runs a 64-bit operating system.
For macOS, there are official All-in-one signed installers for macOS High Sierra (10.13) and newer. QGIS is not yet notarized as required by macOS Catalina (10.15) security rules. On first launch, please right-click on the QGIS app icon, hold down the Option key, then choose Open.
Parts of the QGIS Interface
After installing QGIS, you can run or open it as you would any program in your computer. Upon opening QGIS, you will be greeted with the default User Interface (UI) which would look something like below.
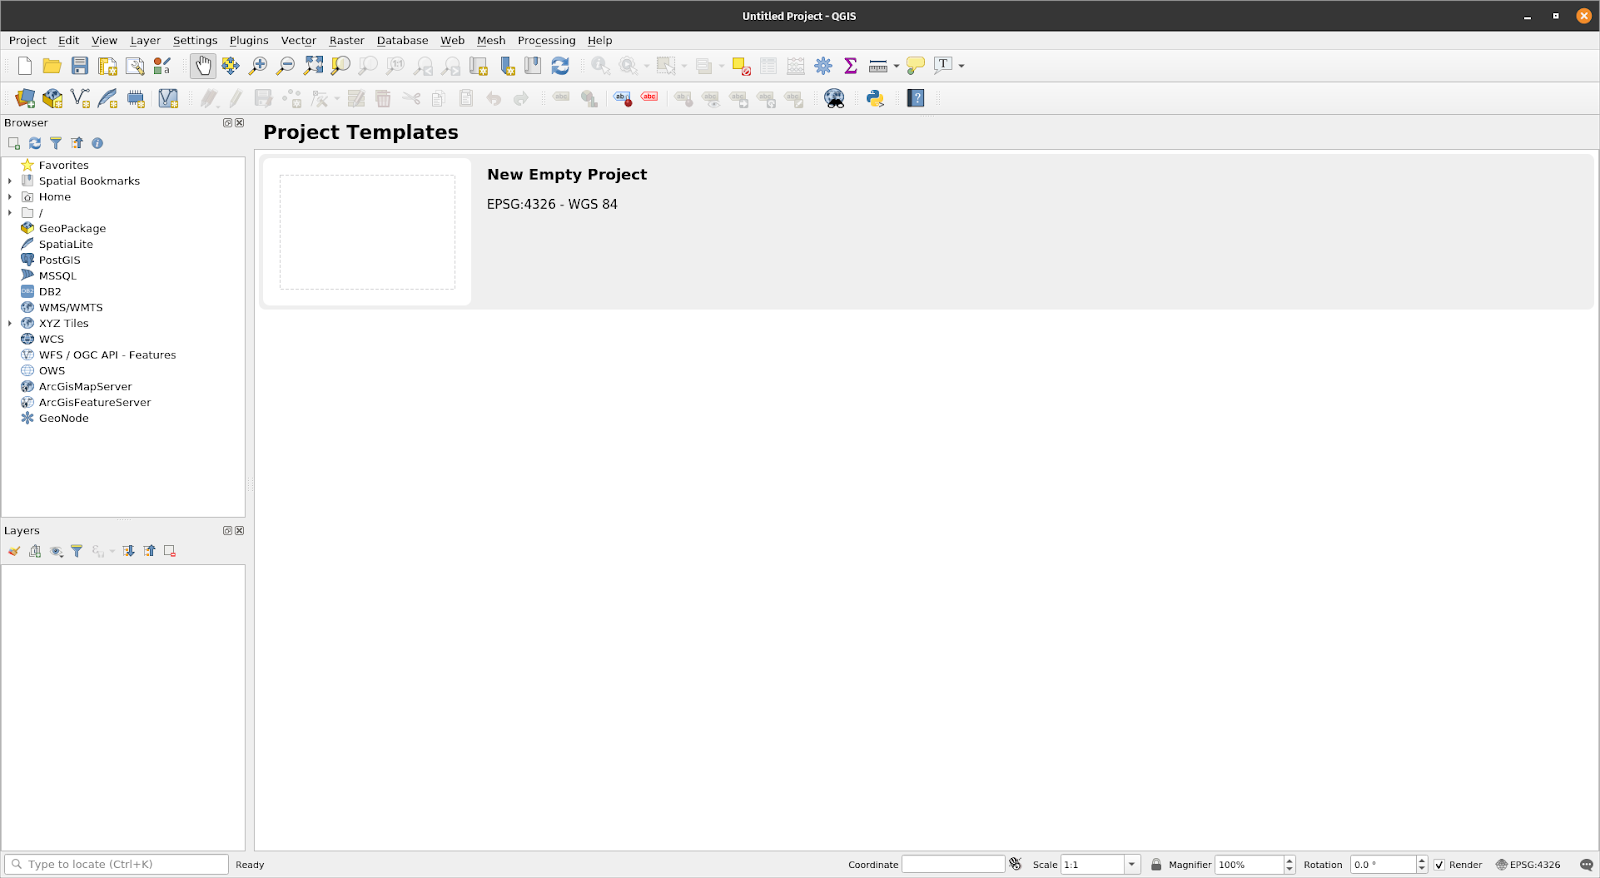
Figure 1.2. The QGIS Interface on a fresh install
There are six main parts of the QGIS User Interface – the Menu Bar, Map Canvas, Toolbars, Panels, Status Bar, and the Locator.
At the center of the UI is a Map Canvas. Panels and Toolbars can be positioned around this canvas. Panels can also be docked together to create a multi-tab Panel. There are also other parts of the UI such as the Python Interface, plugin windows, etc.
Menu Bar - the Menu bar is a simple hierarchical menu that provides access to QGIS functions and commands. It is usually located at the top of the UI.
Map Canvas - the Map Canvas is where layers loaded in QGIS are shown. This is also where filters, selects, and symbologies created by the user are reflected. More than one map canvas can be present at any time. A user can zoom, pan, and even rotate the map canvas. A map canvas can also show 3D data.
Toolbars - toolbars show click-and-run buttons. They allow easy access to QGIS commands, features, plugins, etc. They can be moved and docked around the Map Canvas. The list of toolbars can be found, activated, and deactivated from the Menu bar under View ‣ Toolbars. Examples of toolbars are the Attributes Toolbar and the Digitizing Toolbar.
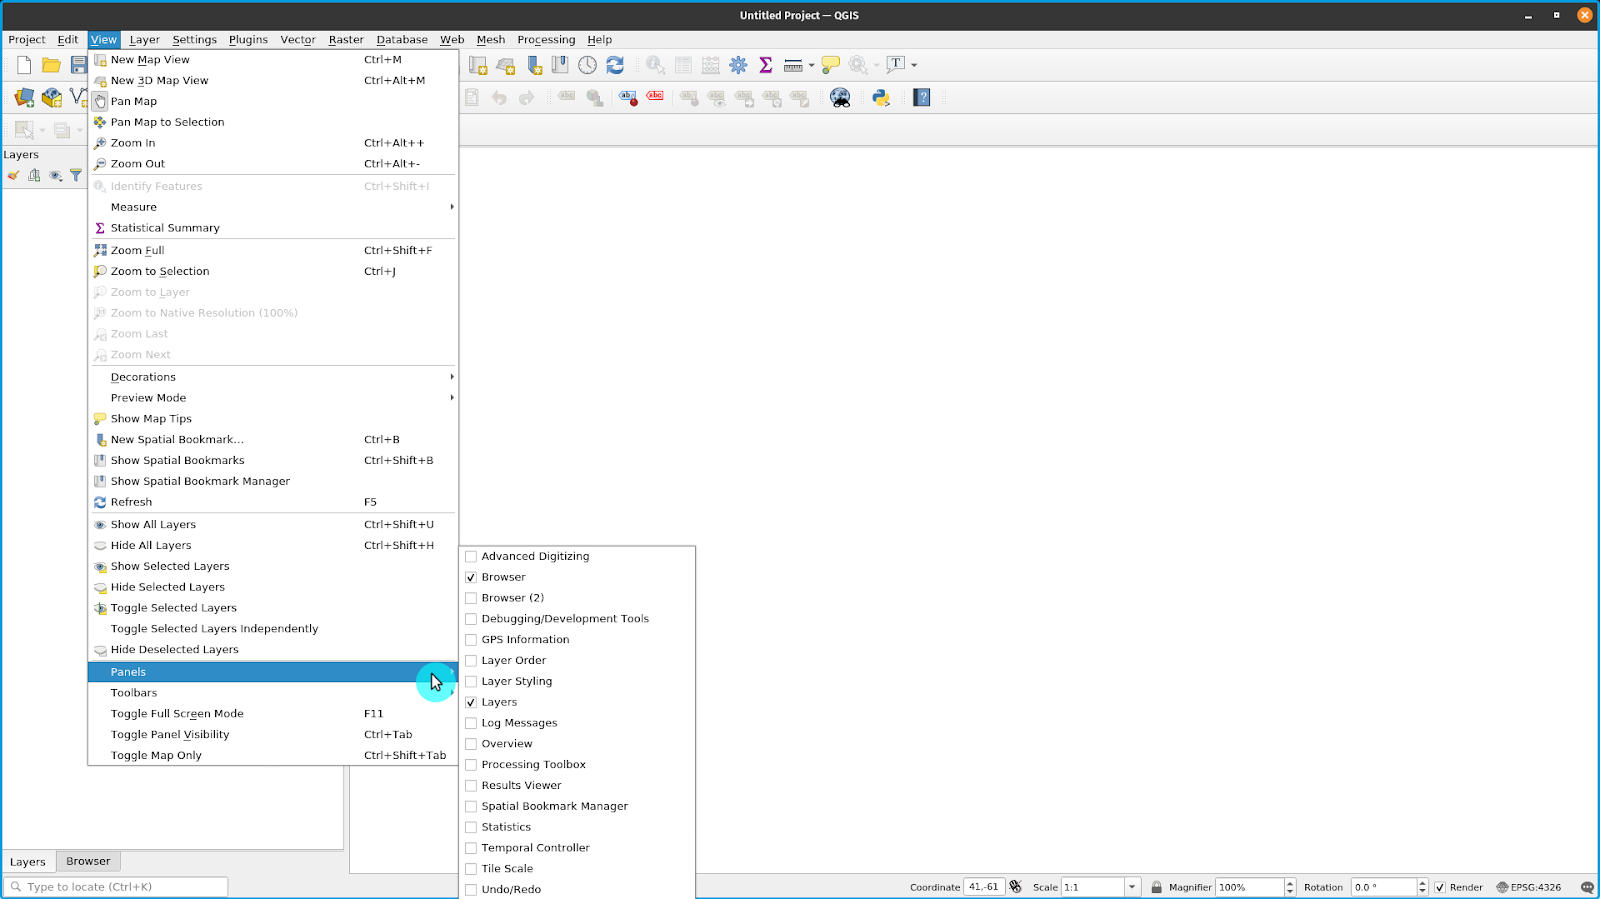
Panels - panels are similar to toolbars but instead of buttons, they provide an interface to more complex functions and features. The Layer Panel and the Browser Panel are examples. Similar to toolbars, they can be moved and docked around the Map Canvas. The list of panels can be found, activated, and deactivated from the Menu bar under View ‣ Panels.
Status Bar - the Status Bar is commonly found at the bottom of the UI and shows relevant information such as the CRS, scale, notifications, etc.
Locator Bar - the Locator bar is found on the bottom left corner of the QGIS interface. It allows the user to easily access layers, fields, processing algorithms, and other things in QGIS. This is one of the most powerful features of QGIS.
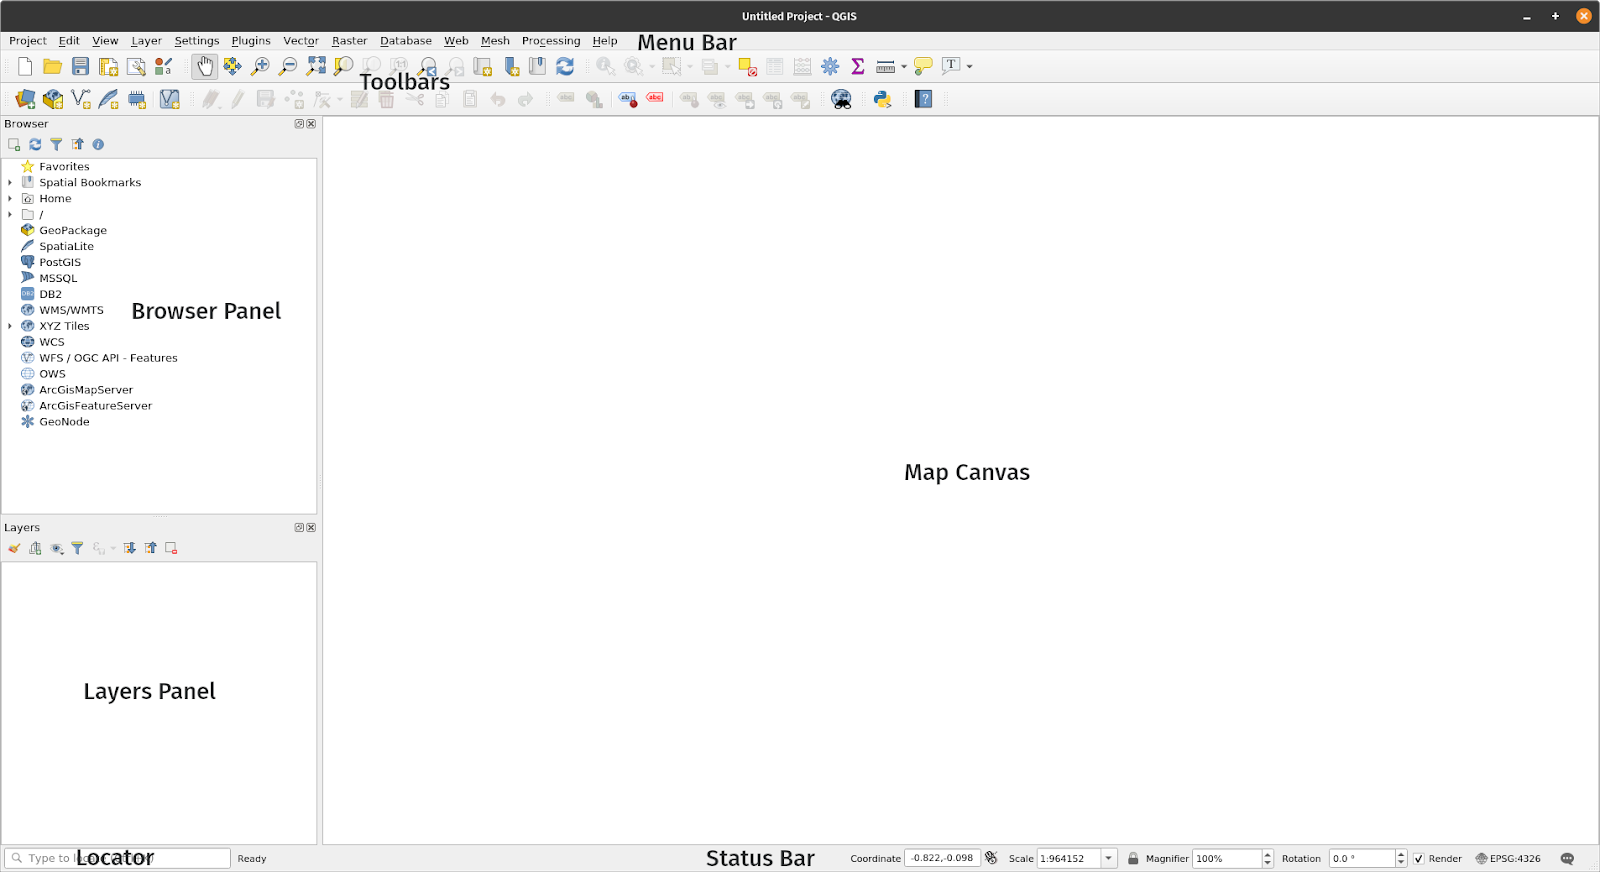
Figure 1.3. Parts of the QGIS Interface
One of the beauties of QGIS is the customizability that it provides its users. This customizability starts with the User Interface. By editing some settings and moving some parts of the interface, you can have a QGIS that looks like the one below:
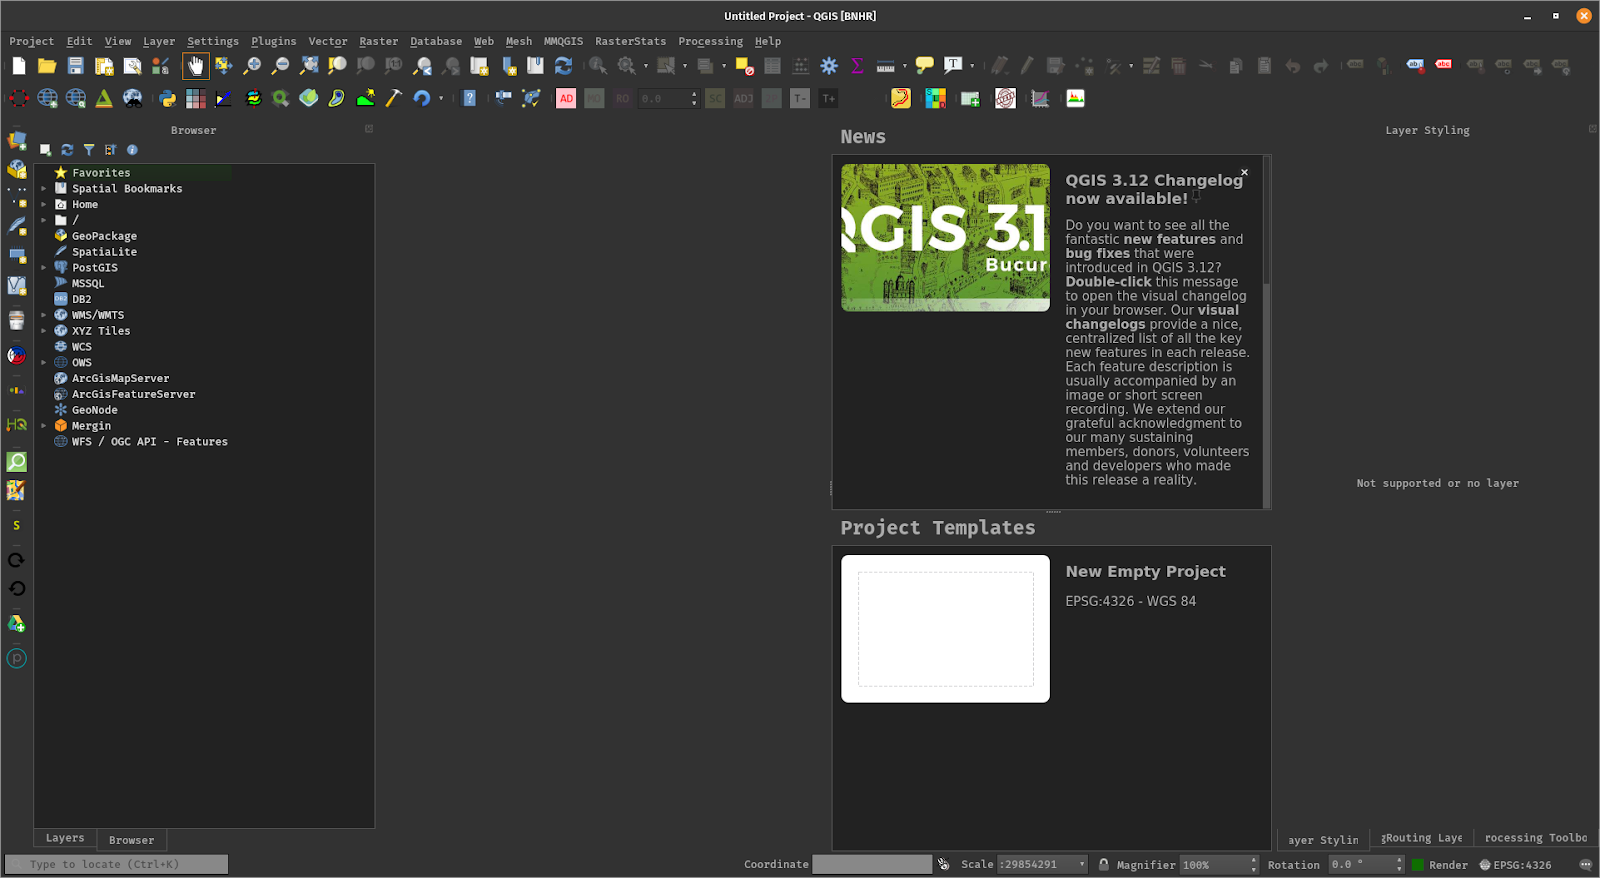
Figure 1.4. The QGIS Interface with some customizations
**Tutorial/Exercise 1: Changing the look and layout of the QGIS Interface
- Open QGIS
- Click the View menu
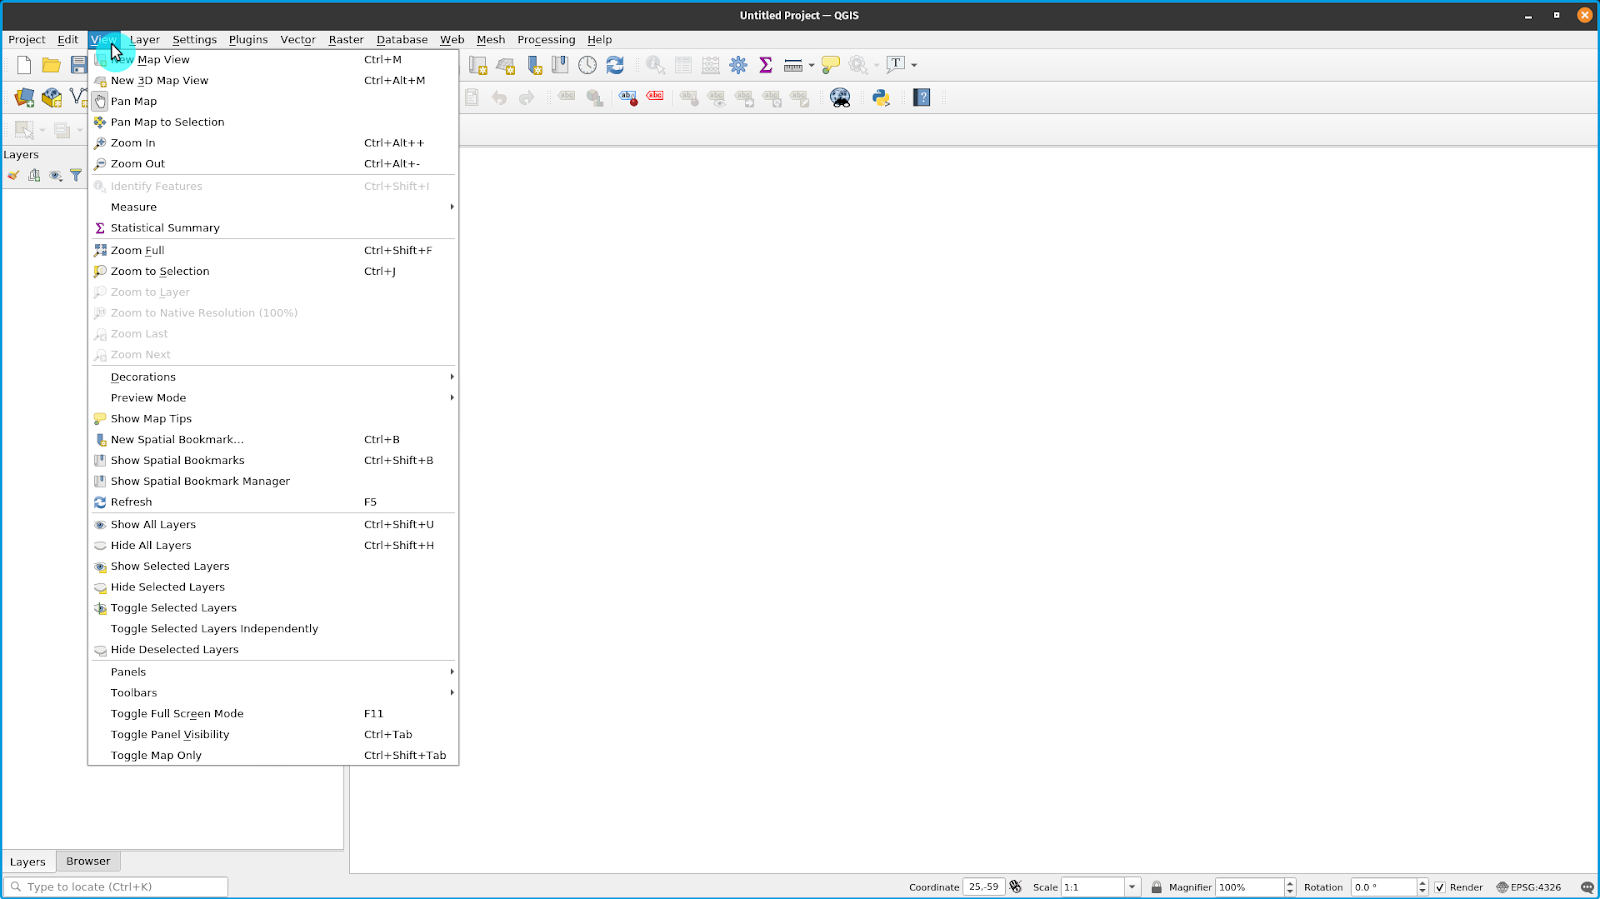
- Observe the Panels menu
- Observe the Toolbars menu
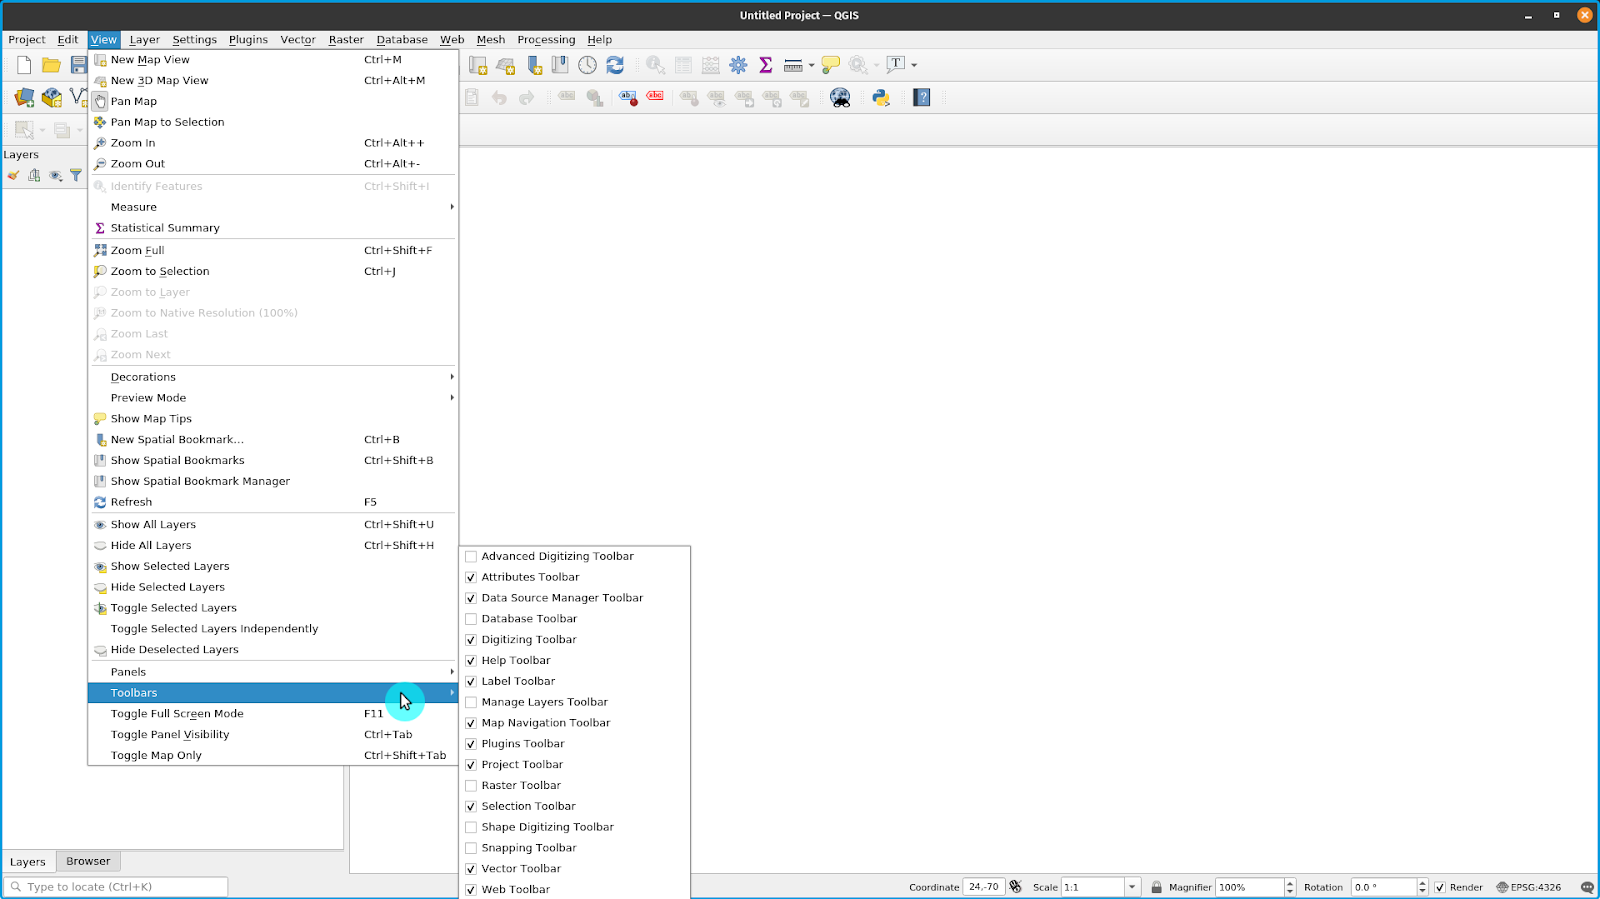
- Select the Toolbars and Panels you want to show in the user interface. Some of the useful Panels include the Layer Styling and Processing Toolbox.
- Move the Toolbars and Panels to the positions that make the most sense for you
Resetting the QGIS Interface
To reset your display to the default settings, go to: Settings ‣ Options ‣ System Tab ‣ Settings ‣ Reset button and restart QGIS
**Quiz questions
- True or False:
- You can have multiple map canvases – True
- You can show or hide panels and toolbars – True
- You can only put Panels on the left or right side of the Map Canvas – False (you can also put panels above or below the Map Canvas)
Phase 2 title: QGIS Plugins
The ability to add, create, and extend QGIS’ functionality via plugins is one of its most powerful features.
As of QGIS 3.16.3, there are more than 700 plugins available for the user to download and improve upon. These plugins range in function from the complex to the mundane.
QGIS plugins can be classified as:
- Core plugins - built-in to your version of QGIS, cannot be uninstalled
- External plugins - manually installed by fetching from an external repository (i.e. QGIS Official Plugin Repository) or via the source code.
Plugins can be installed in three (3) ways:
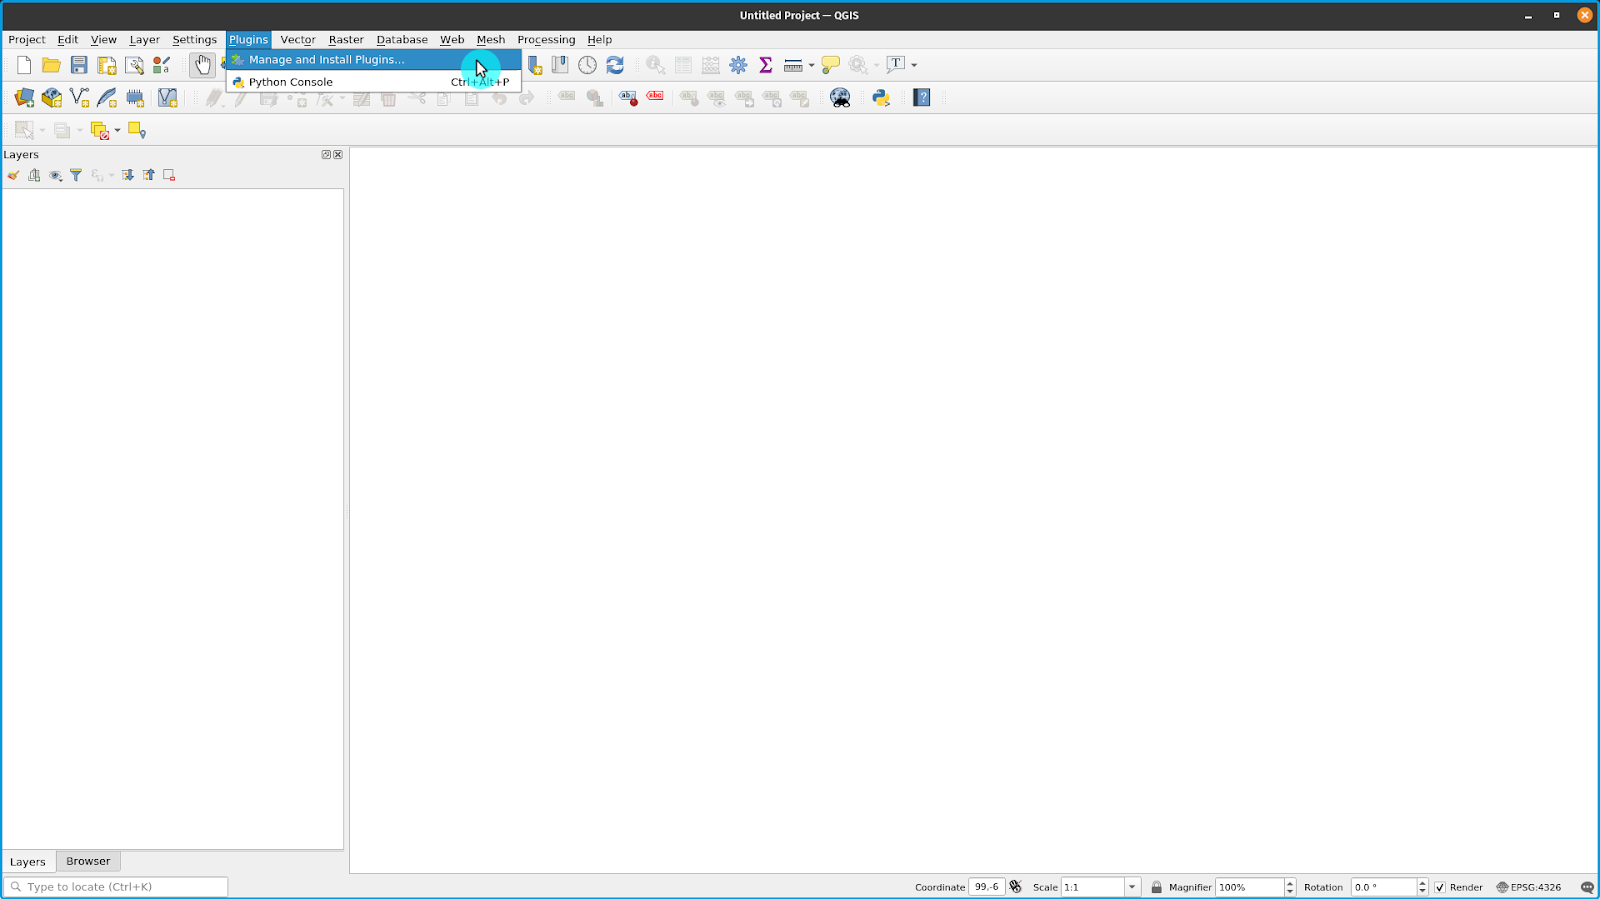
- Via the Manage and Install Plugins Dialog (Plugins ‣ Manage and Install Plugins)
- Installing from ZIP which can be accessed under the Install from ZIP tab in the Manage and Install Plugins dialog.
- Manually adding the source code in your QGIS profile’s plugins folder. This folder can usually be found at:
- Linux: .local/share/QGIS/QGIS3/profiles/default/python/plugins
- Mac OS X: Library/Application/Support/QGIS/QGIS3/profiles/default/python/plugins
- **Windows: **C:\Users
\AppData\Roaming\QGIS\QGIS3\profiles\default\python\plugins
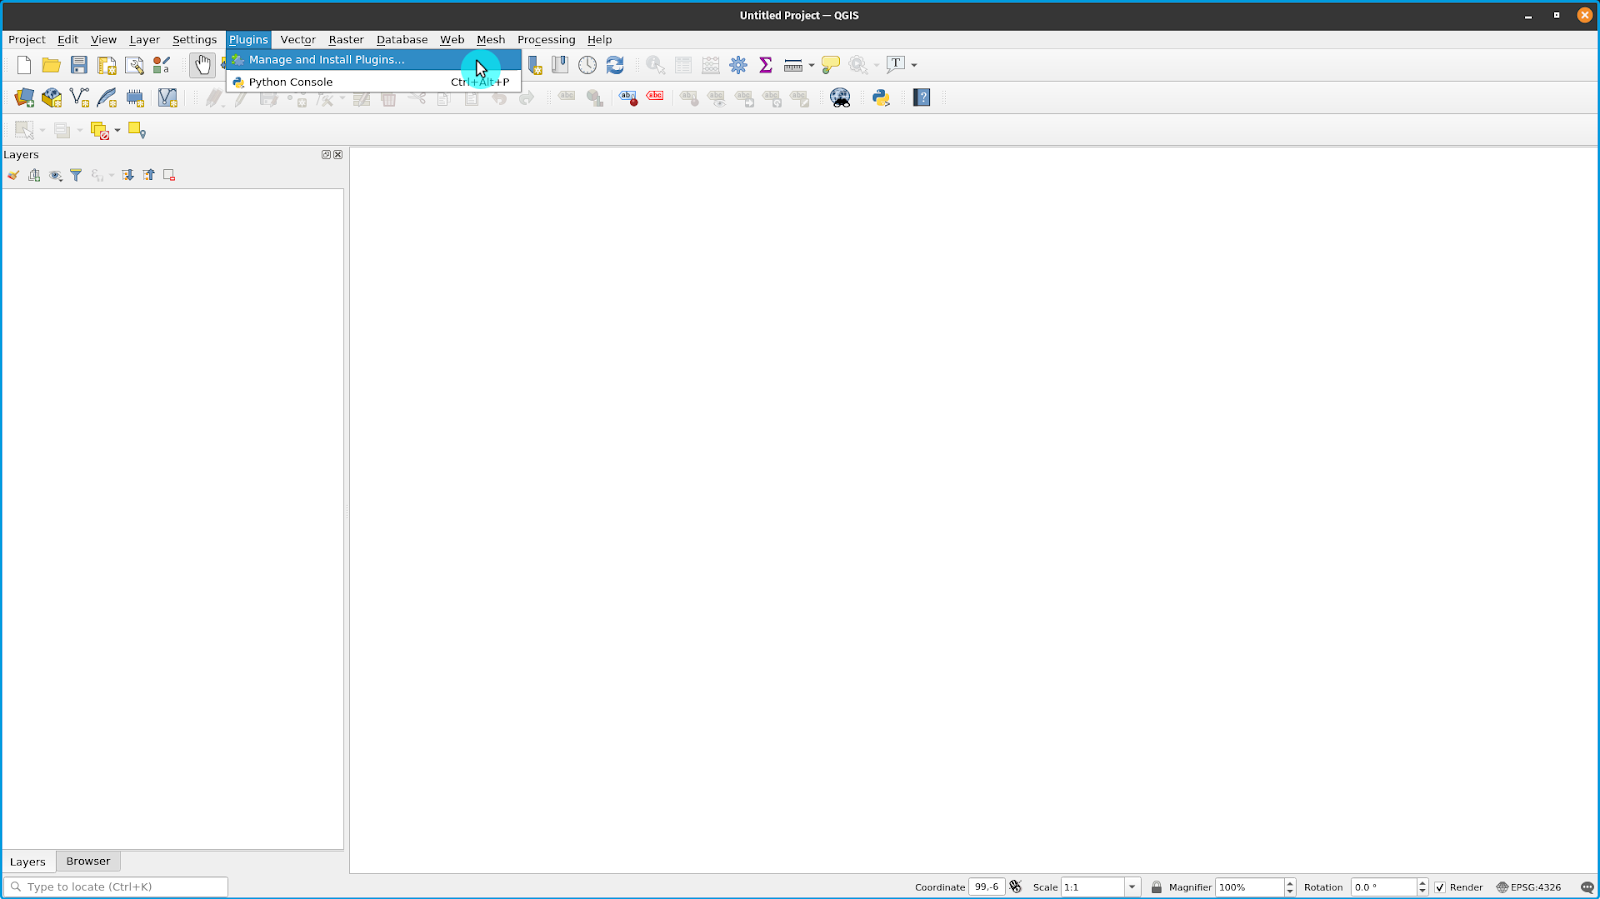
Figure 1.5. Accessing the Manage and Install Plugins dialog
Manage and Install Plugins Dialog
The Manage and Install Plugins Dialog connects to the QGIS Official Plugin repository (or any repository that you indicate in the Settings Tab) to fetch plugins available for your version of QGIS. It has five (5) tabs:
- All Tab – shows ALL the plugins available for your QGIS version including those that are already installed on your machine
- Installed Tab – shows only the plugins installed on your machine
- Not installed Tab – shows the plugins that are not installed on your machine
- Install from ZIP – allows you to install plugins from a ZIP file
- Settings Tab – gives you options on when to check for plugin updates, whether or not to include experimental and deprecated plugins, or add/change the repository to fetch plugins from
If the plugin you are looking for is tagged as experimental or deprecated, you need to check Show experimental plugins and Show deprecated plugins from the Settings tab.
The Search Bar allows you to search for plugins found in the plugin repository/ies that you are connected to.
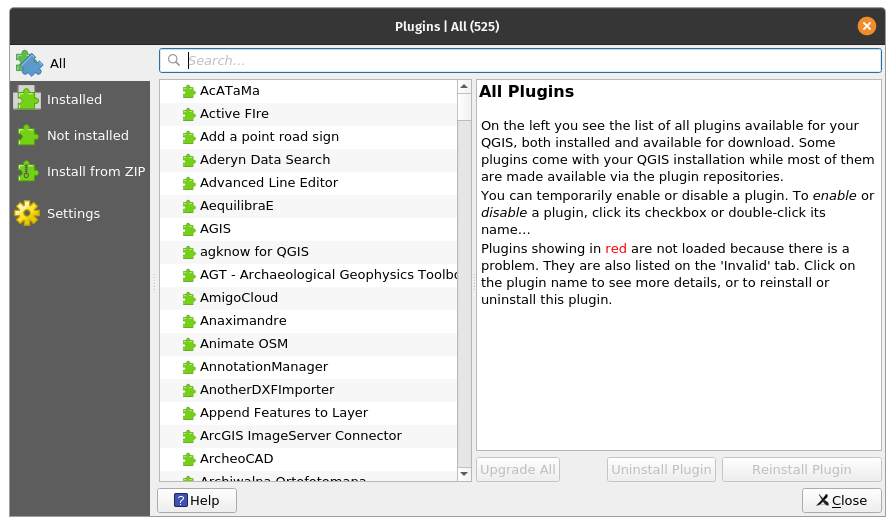
Figure 1.6. The Manage and Install Plugins dialog
Tutorial/Exercise 2: Installing a QGIS Plugin
- Open the Manage and Install Plugins dialog from Plugins ‣ Manage and Install Plugins from the Menu bar. This will open the Manage and Install Plugins dialog.

-
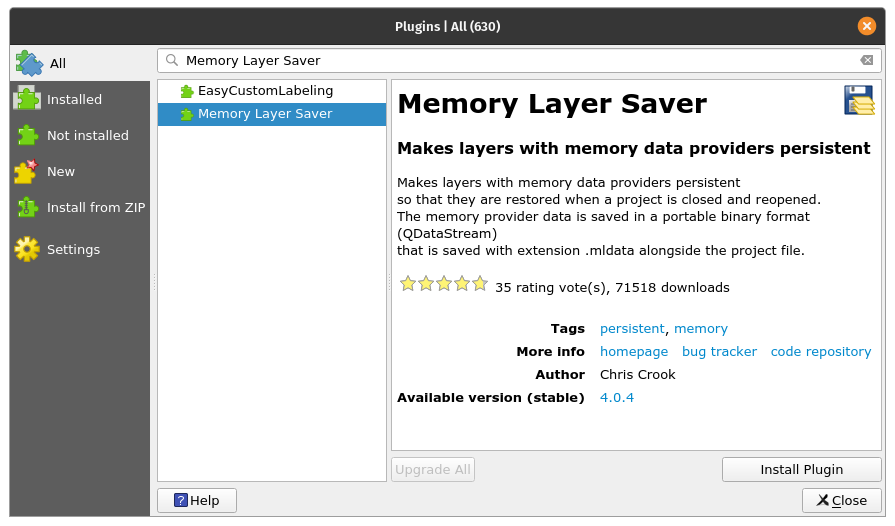
Install the following plugins by searching for them in the All tab and clicking Install Plugin in the bottom right corner of the Manage and Install plugins dialog.
- Memory Layer Saver
- QuickOSM
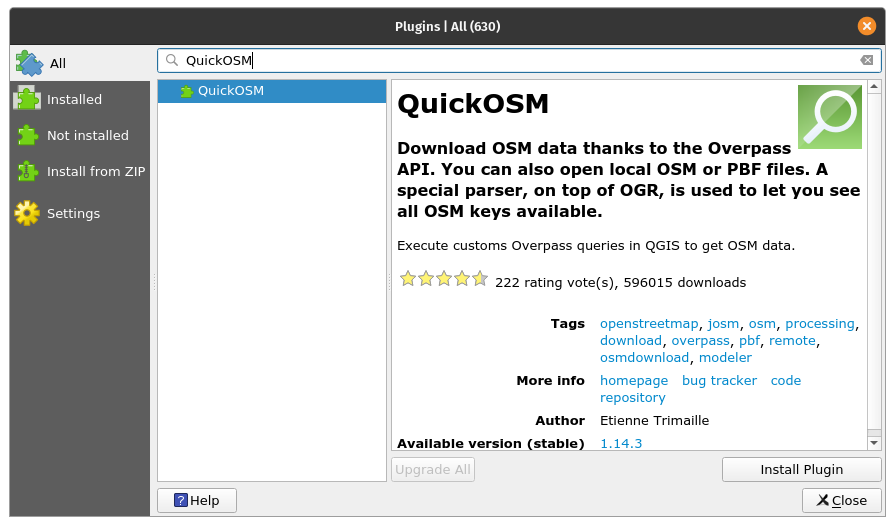
- Check if the plugins are successfully installed. The Memory Layer Saver plugin should be available at Plugins ‣ Memory Layer Saver in the Menu bar while the QuickOSM plugin should be available from Vector ‣ QuickOSM in the Menu bar.
Quiz questions
- True or False
- You can remove or uninstall Core plugins – False
- You can add plugins that are not found in the Official QGIS Plugin Repository – True
Phase 3 title: QGIS Settings
System and Project Settings
QGIS Settings allow you to edit and manage different things about QGIS such as user profiles, styles, coordinate reference systems, keyboard shortcuts, the user interface, default colors, etc. System settings can be found in the Settings **menu and are the default settings used by QGIS unless they are overridden by a Project’s settings. Project Settings can be found in **Project ‣ Properties and pertain to settings or properties for the current project. These values override the system defaults.
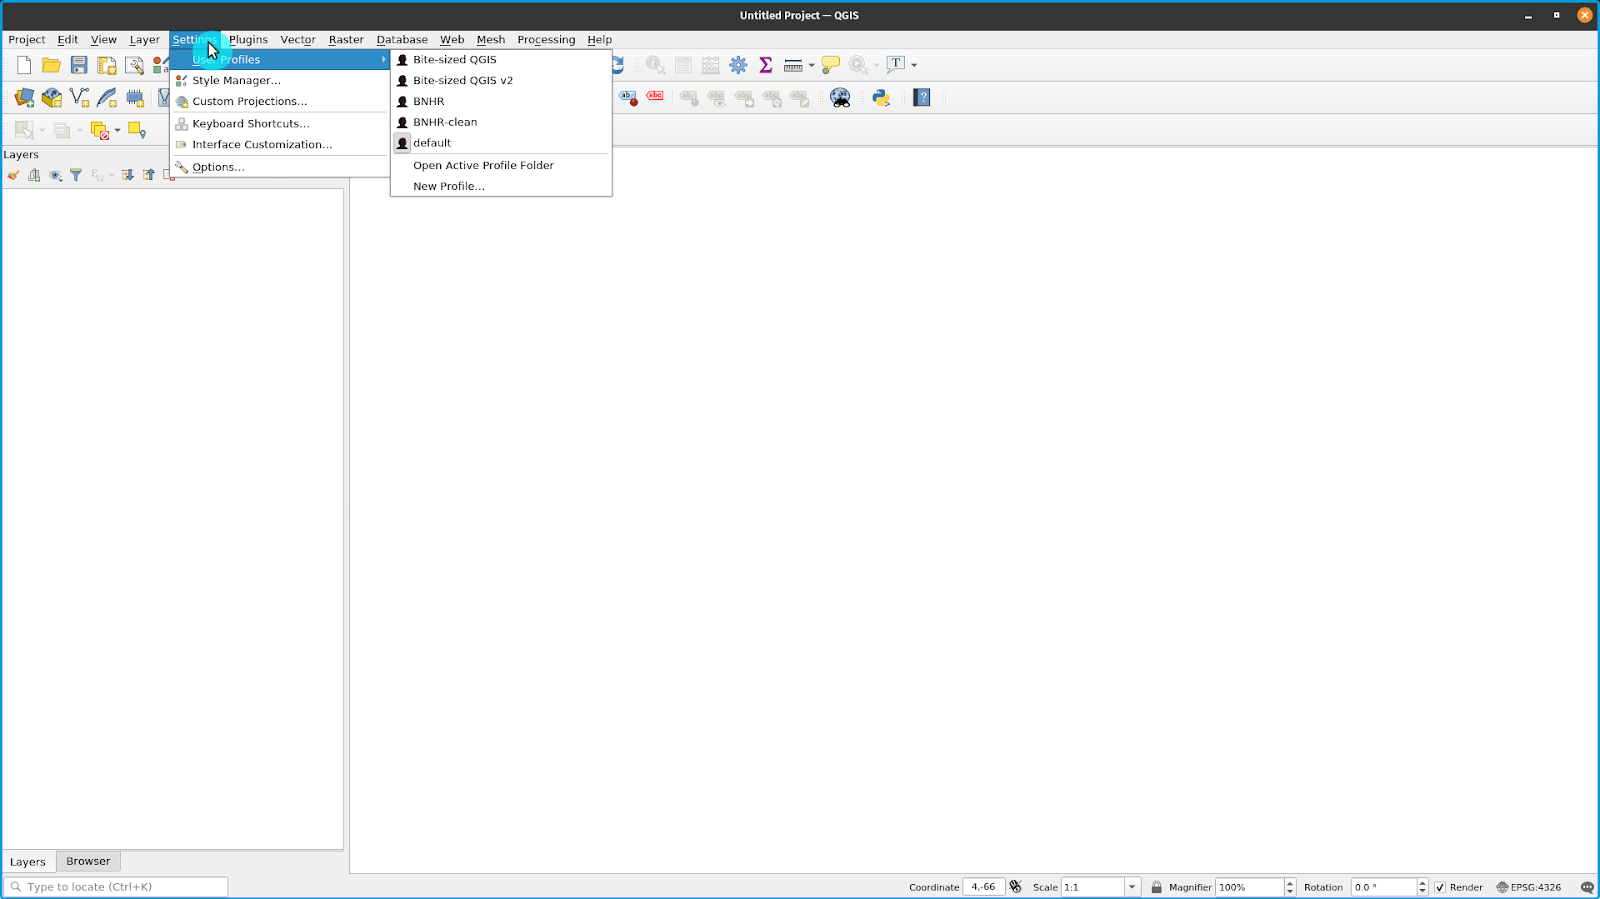
Figure 1.7. The System Settings
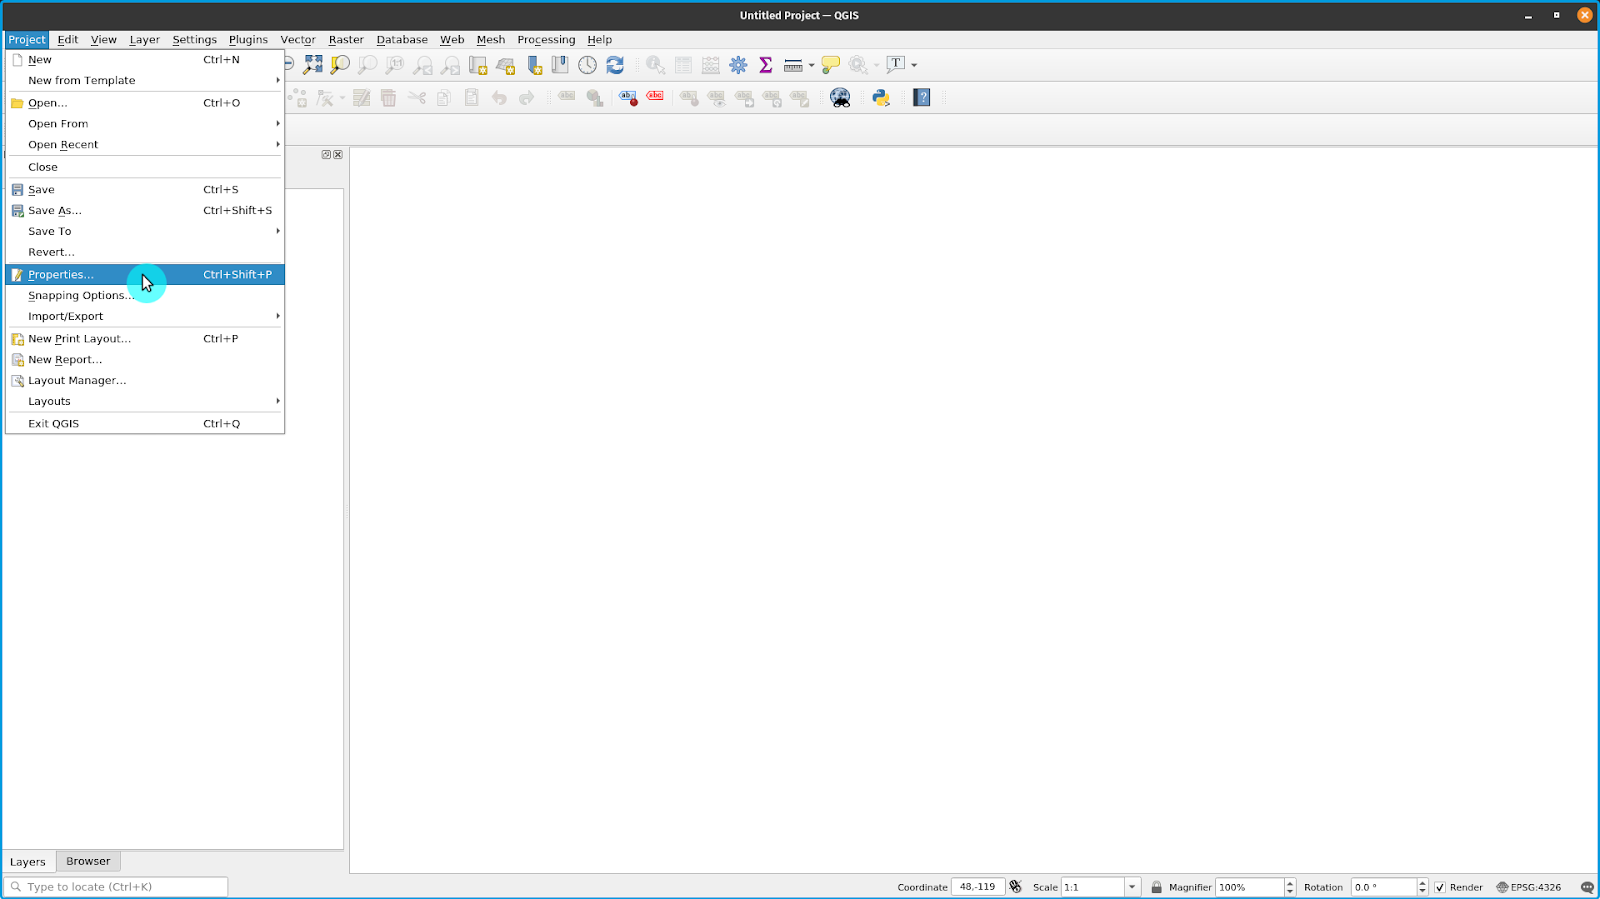
Figure 1.8. Project Settings
Changing the QGIS Theme
You can change the look-and-feel of QGIS under Settings ‣ Options ‣ General Tab.
You can choose between three themes – default, Blend of Gray, and Night Mapping. You can also change the size of the icons, the font used by QGIS, and other system defaults.
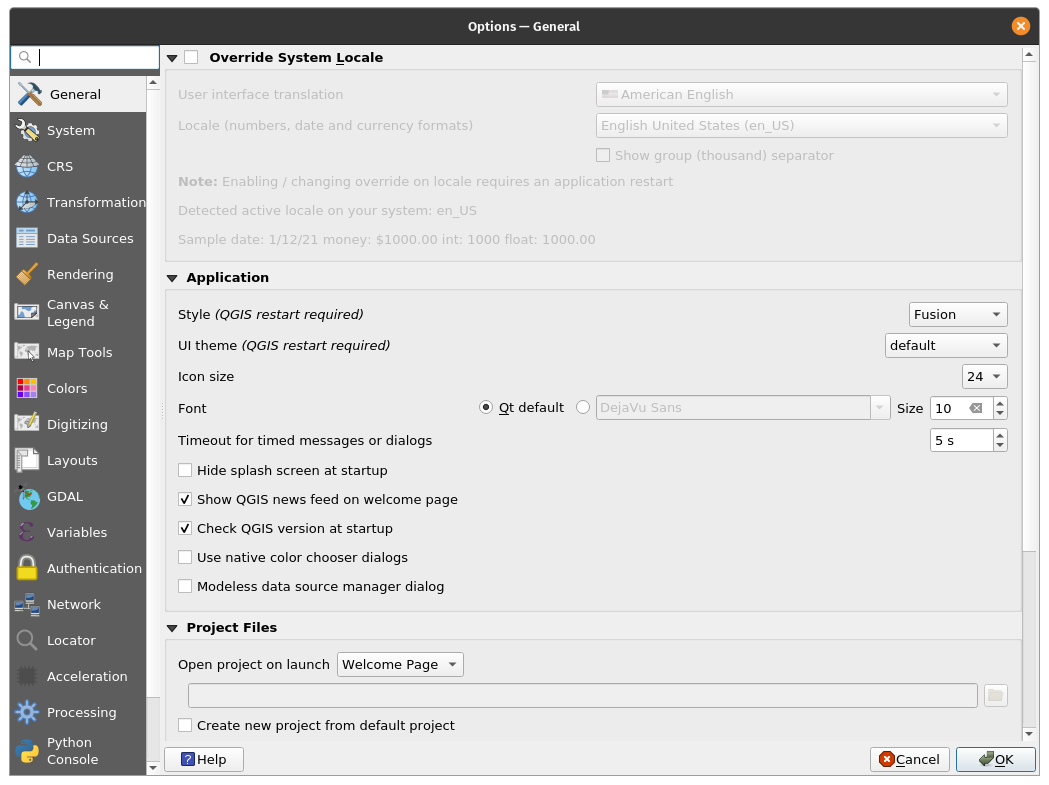
Figure 1.9. General Settings of QGIS
For some settings in QGIS, you might need to restart the application for them to take effect.
User Profiles
QGIS 3.X introduced the concept of QGIS User Profiles.
A User Profile is a collection of settings for plugins installed, toolbars enabled, arrangement of the User Interface, and other settings. QGIS comes with a default User Profile named default. User profiles allow the user to create different settings for specific analyses (e.g. a user profile specific for water resource management, digitizing data, cartography, etc.), particular projects, or even clients.
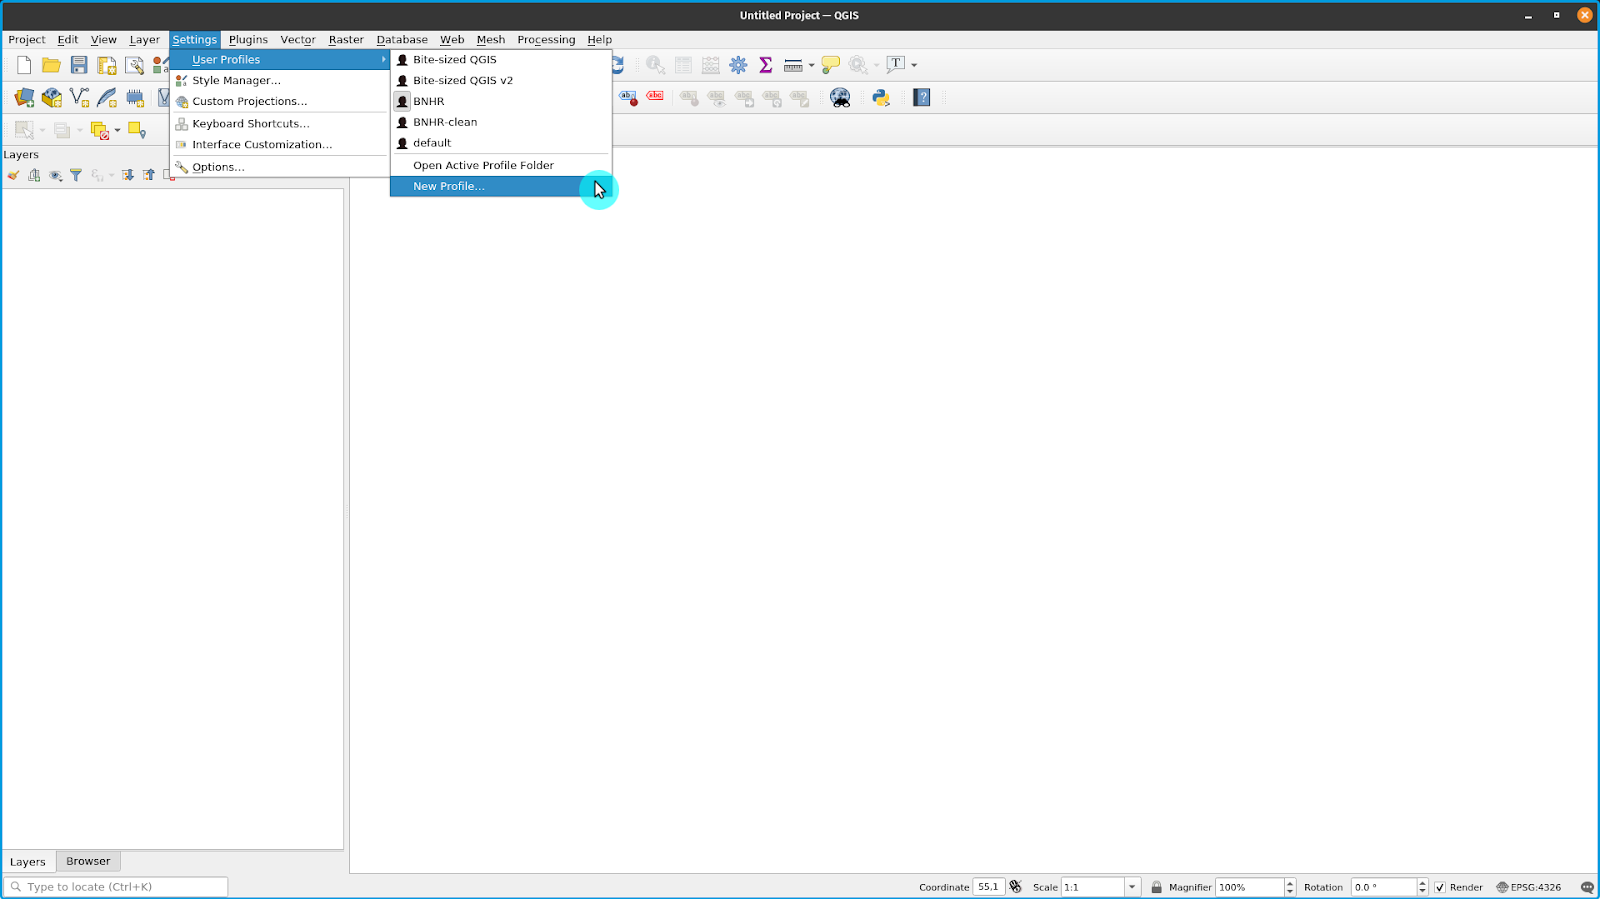
User Profiles can be created and accessed from the menu bar under: Settings ‣ User Profiles.
The active user profile is shown with [User Profile] in the title bar.
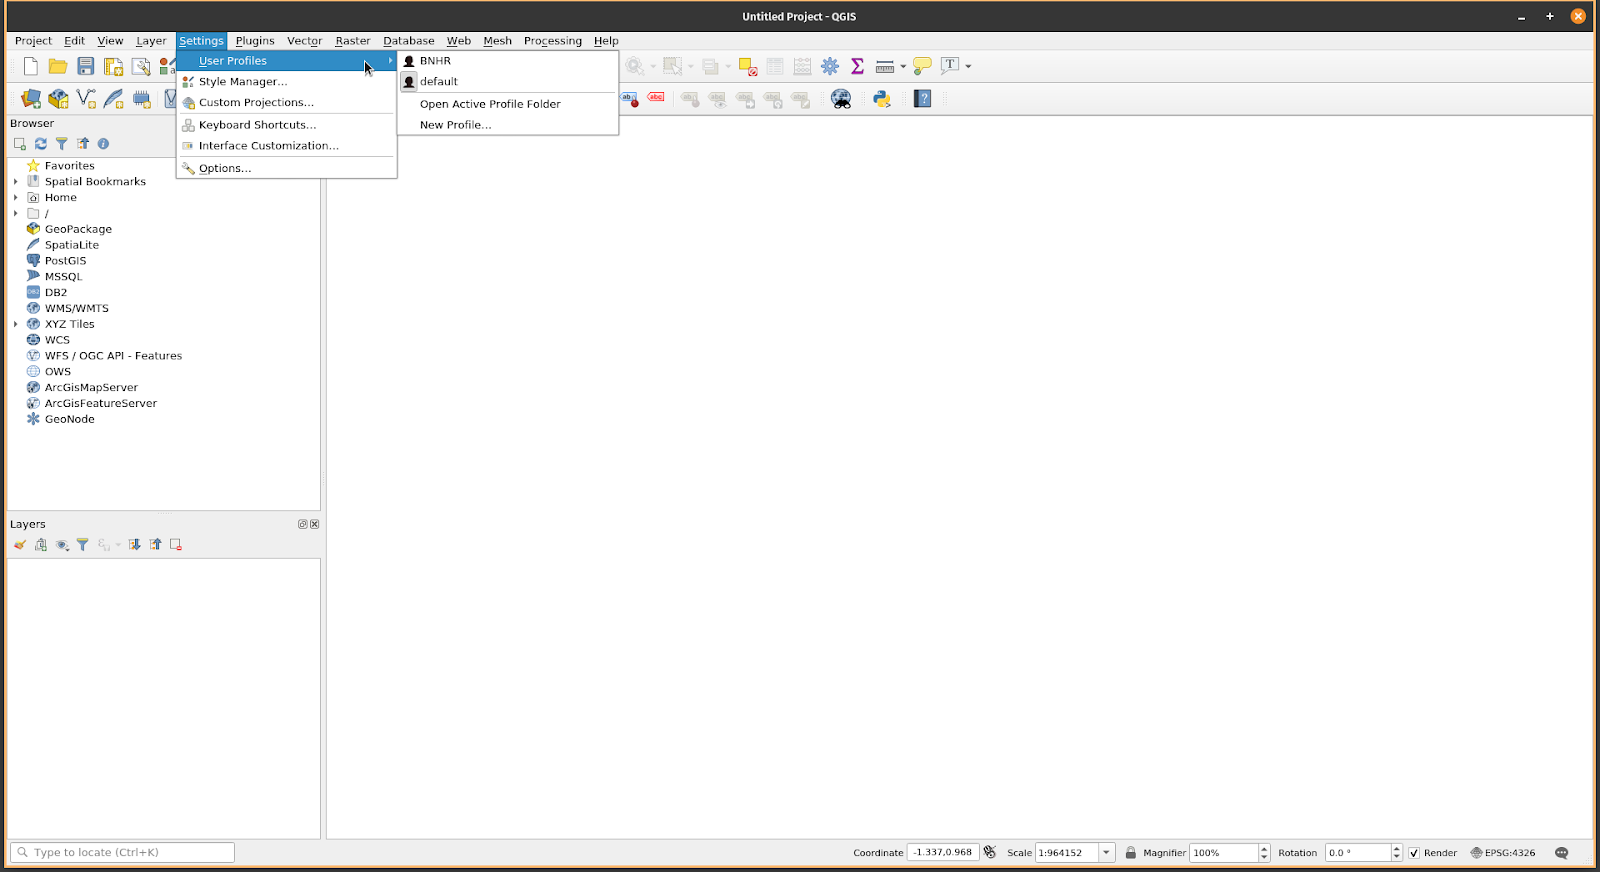
Figure 1.10. Accessing User Profiles
User profiles are saved in a directory on your computer which can be accessed by clicking Settings ‣ User Profiles ‣ Open Active Profile Folder.
Tutorial/Exercise 03: Creating a User Profile
- Go to Settings ‣ User Profiles ‣ New Profile…
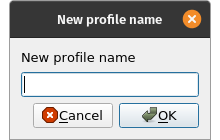
- Give your new user profile a name.
-
A new QGIS window should open with your new user profile. Notice that your profile name is shown in the QGIS title bar.
-
Do you notice any difference in the new user profile? Check the user interface, plugins, and settings of the old profile and the new profile you created.
Quiz questions
- True or False
- You can only have one user profile in QGIS. – False (you can have multiple user profiles)
- You can’t override the system settings and properties. – False
Phase 4 title (additional): QGIS File Formats
QGIS Project File (QGS/QGZ)
QGIS Projects are to QGIS as .mxd files are to ArcMap. These files come either as QGS (.qgs) or QGZ (.qgz). The main difference between the two is that the QGZ format is a compressed (zip) archive containing a QGS file and a QGD file. The QGS format is an XML format for storing QGIS projects. The QGD file is the associated sqlite database of the qgis project that contains auxiliary data for the project. If there are no auxiliary data, the QGD file will be empty.
A QGIS Project File contains everything that is needed for storing a QGIS project, including:
- project title
- project CRS
- the layer tree
- snapping settings
- relations
- the map canvas extent
- project models
- legend
- mapview docks (2D and 3D)
- the layers with links to the underlying datasets (data sources) and other layer properties including extent, SRS, joins, styles, renderer, blend mode, opacity and more.
- project properties
QGIS Project files can be saved in a GeoPackage or a PostGIS database. Saving the project file together with the style file and corresponding layers in a single GeoPackage makes it easy to share QGIS projects.
QGIS Layer Definition (QLR)
A QGIS Layer Definition file (QLR) is an XML file that contains a pointer to the layer data source in addition to QGIS style information for the layer. Currently, a QLR file corresponds to a single layer only.
The use case for this file is simple: To have a single file for opening a data source and bringing in all the related style information. QLR files also allow you to mask the underlying datasource in an easy to open file.
An example of QLR usage is for opening a layer from a PostGIS database. Instead of connecting to the database, finding the layer, and applying a filter, you can just open a .qlr file that points to the correct PostGIS layer with its corresponding style and filter.
QGIS Style File (QML)
QML is an XML format for storing layer styling. A QML file (.qml) contains all the information that tells QGIS how to render feature geometries which includes symbol definitions, sizes and rotations, labelling, opacity, blend mode, and more.
A .qml file should have the same name as the data source it corresponds to. When it is found in the same directory or folder as the data source, loading the data source will also automatically load its style as defined in the .qml file.
For example, if you have a GeoJSON named regions.geojson and a QML file named regions.qml, loading regions.geojson in QGIS will apply the styles defined in regions.qml in the loaded layer.
When using GeoPackages (.gpkg), a .qml file is oftentimes not needed since you can save a layer’s style directly in the geopackage.
If you want to go further:
You can try to create your own QGIS plugin. If there’s no plugin that does what you want then you can always make one yourself.
The Plugin Builder is a plugin that creates a template that can serve as the starting point for QGIS plugin development so you won’t have to create one from scratch. You can install it from the Manage and Install Plugins Dialog.
Of course, you can always create a plugin from scratch. If you are interested in creating your own plugin, you can check the Official QGIS documentation (https://documentation.qgis.org/). For Python plugins, it’s a good idea to check out the PyQGIS Developer Cookbook (https://docs.qgis.org/3.16/en/docs/pyqgis_developer_cookbook/).
For more information, see: https://bnhr.xyz/2018/10/08/qgis-plugins-3.0.html
To practice your new skills, try to…
- Change the theme and look of the QGIS user interface to suit your preference.
- Install other QGIS plugins.
- Change other QGIS settings.
- create a custom coordinate reference system
- add a custom splash screen (https://bnhr.xyz/2020/09/05/custom-splash-screen-qgis.html)
Tips
N/A